|
Food consumption patterns change over time. Most consumer surveys of dietary intake cover one or several years of consumption, and many are not representative of the total U.S. population. So how do we track U.S. consumption patterns over time?
ERS has developed a unique data system that provides proxies for actual consumption. The ERS Food Availability (Per Capita) Data System includes three separate but related data series that look at different aspects of U.S. food consumption:
These series are constructed using a wide array of data, such as annual production, imports, exports, nonfood uses, and beginning and ending stocks for each commodity along with information on serving weights, data on the nutrient composition of foods, and the number of residents in the United States.
Food availability and dietary trends
The Food Availability data series estimates consumption trends over time, with data extending back to 1909 for many commodities. The data are most commonly used to do:
- Measure the average level of U.S. food available for consumption.
- Serve as a proxy for food consumption.
- Show year-to-year changes in the food availability of major foods.
- Identify long-term consumption trends.
- Permit statistical analyses of effects of prices and income on food consumption.
- Make custom graphs of the availability of particular food groups or foods.
For more information on the data, see:
Food Availability Data Documentation.
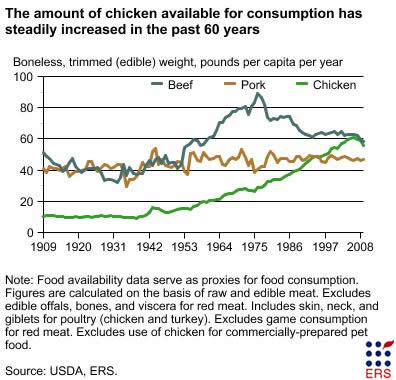
The Food Availability data show that food consumption patterns have changed considerably since 1970. In 2009, each American had available to consume, on average, 54 pounds more commercially grown vegetables than in 1970; 60 pounds more grain products; 19 pounds more fruit; 11 pounds more caloric sweeteners; 36 pounds more poultry, and 4 pounds more fish and shellfish (boneless, trimmed equivalent); 21 pounds more cheese; and 25 pounds more added fats and oils. Each American, on average, also had available to consume 26 pounds less red meat, 63 fewer eggs, 10 gallons less coffee, and 11 gallons less milk.
MyPyramid equivalents and dietary trends
The ERS Loss-Adjusted Food Availability data are derived from ERS Food Availability (Per Capita) data and are adjusted for food spoilage and other losses to more closely approximate actual per capita food intake. The "loss-adjusted" data are converted into daily per capita food intake, which is presented in two forms: the number of calories consumed daily (per capita) and MyPyramid equivalents (per capita) as defined by the 2005 Dietary Guidelines for Americans. The data are most commonly used to:
- Provide estimates of the average daily intake of U.S. food in terms of MyPyramid equivalents and calories.
- Show year-to-year changes in consumption of major foods.
- Provide insight about consumption trends since 1970.
- Permit statistical analyses of effects of prices and income on food consumption.
For more information on how the data are constructed, see: Loss-Adjusted Food Availability Data Documentation.
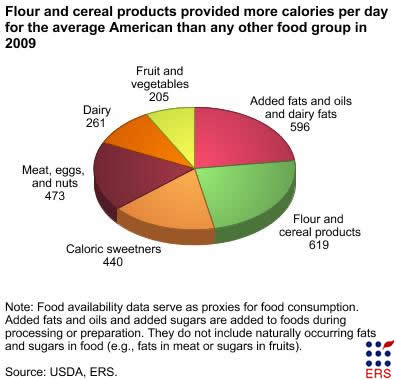
According to the Loss-Adjusted Food Availability data, Americans are consuming more calories per day than they did nearly 40 years ago. In 1970, Americans consumed an estimated 2,169 calories per person per day whereas in 2009, they consumed an estimated 2,594 calories (after adjusting for plate waste, spoilage, and other food losses). Of this 425-calorie increase, grains (mainly refined grains) accounted for 187 calories; added fats and oils, 168 calories; caloric sweeteners, 39 calories; dairy fats, 17 calories; fruits and vegetables, 11 calories; and meats, 10 calories. Only dairy products declined (5 calories).
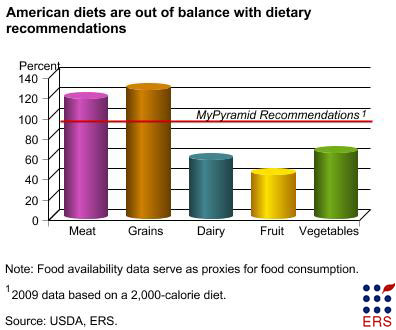
The Loss-Adjusted Food Availability data can also be used to estimate how closely American diets align with dietary recommendations.
Nutrient availability and dietary trends
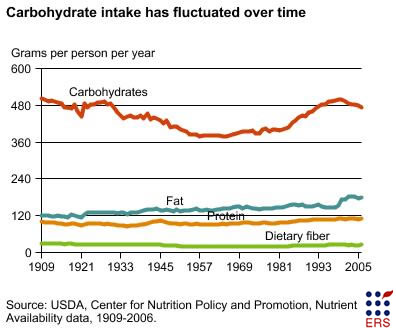
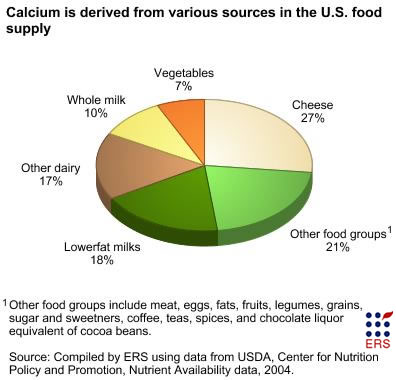
USDA’s Center for Nutrition Policy and Promotion (CNPP) uses the ERS Food Availability data to calculate the amounts per capita per day of food energy (calories) and 27 nutrients and food components (i.e., protein, carbohydrates, fats, vitamins, and minerals) in the U.S. food supply. The ERS website provides select Nutrient Availability spreadsheets, which summarize the nutrients and other food components available per capita per day in the U.S. food supply between 1970 and 2006, and the nutrients contributed by the major food groups, per capita per day for 1970 and 2004. The entire historical series, including an interactive version of the data, is available on the CNPP website. Like the Food Availability data, this historical data series begins in 1909.
The data are most commonly used to:
- Estimate the nutrient content of the U.S. food supply, including the:
- Amount of nutrients per capita per day of food available for consumption and
- Information about the nutrient contributions from the major food groups.
- Show year-to-year changes in consumption of nutrients.
- Show year-to-year changes in the contribution of nutrients by the major food groups.
- Establish long-term trends in nutrient availability and use by type of food.
- Permit statistical analyses of effects of prices and income on nutrient intake.
For more information on how the data are constructed, see: Nutrient Availability Documentation.
|


