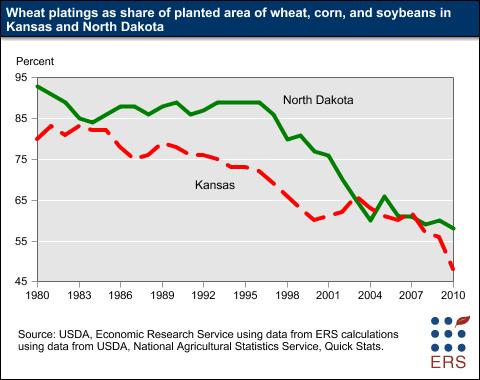
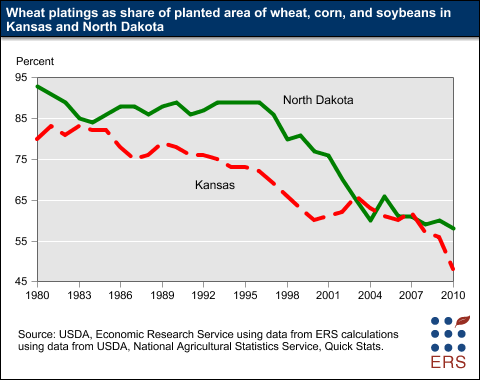
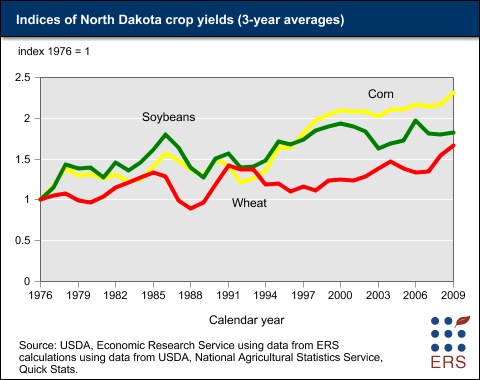
The pace of genetic improvement has been slower for wheat than for some other field crops, resulting in little growth in wheat yields, which makes wheat a less attractive cropping option for farmers. Genetic improvement for wheat has been slower because of genetic complexity and because of lower potential returns to commercial seed companies, factors that discourage investment in research. For instance, farmers have to buy seed corn each year because seed saved from a hybrid cannot be used for a subsequent crop. This creates a large annual market for seed companies and the returns to investment needed to finance breeding programs to develop improved varieties. In contrast, many wheat farmers, particularly in the Plains States, use saved seed from the previous year's crop instead of buying from dealers every year because the wheat varieties grown in the United States are not hybrids. This practice sharply reduces the potential market for branded commercial seed wheat and, thus, investment in seed development research.
Just as U.S. wheat production faces pressures from multiple
factors, several domestic and international market factors
underlie long-term developments for U.S. wheat demand
during 2011-20.
Get this chart as a
JPG
or a
PNG.
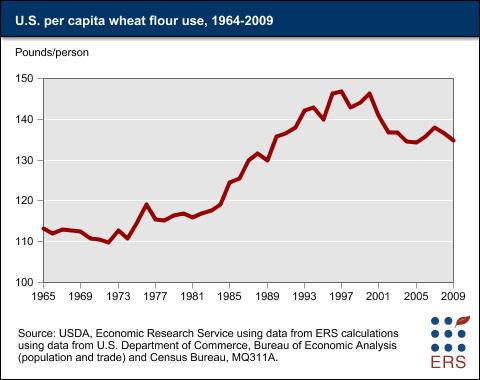
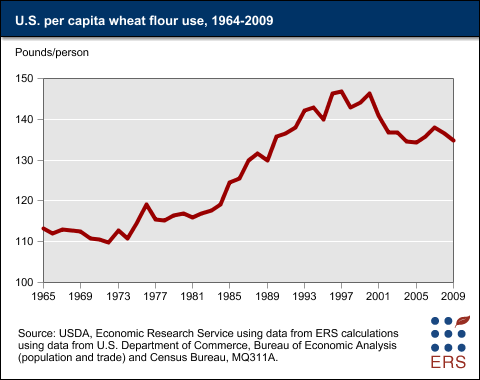
For nearly 100 years, per capita wheat use had declined in the United States, as strenuous physical labor became less common and diets became more diversified. Wheat use dropped from over 225 pounds per person in 1879 to a low of 110 pounds in 1972. By 1996, use had rebounded to 146.8 pounds per capita. The overall growth in per capita use that occurred between 1973 and 1997 reflected changes that included the boom in away-from-home eating, the desire of consumers for greater variety and more convenience in food products, promotion of wheat flour and pasta products by industry organizations, and wider recognition of health benefits stemming from eating high-fiber, grain-based foods.
This growth ended in 1997 due to changing consumer preferences,
including more weight-conscious people following diets
with fewer carbohydrates. Consumer interest in these diets
spiked in 2000. The sharp drop in per capita flour use
that began in 2000 seems to have ended.
Grain milled is reduced by high extraction rates of recent years.The flour extraction rate varies, in part, with the plumpness of the grain kernels and the diligence with which mills are kept adjusted to optimize flour extraction. Plumpness is greater when the wheat crop is not stressed by moisture shortages during the grain filling production stage. The higher the price of wheat, the more it pays for managers to continuously adjust their mill to optimize the extraction rate. Significant portions of the 2009/10 crop, and also the 2008/09 crop, were not stressed by moisture shortages and both crops had high prices.
High flour extraction rates mean that fewer bushels of wheat need to be milled to produce a given quantity of flour. At 77.1 percent the 2009/10 rate was up slightly from the 77.0 percent rate for the 2008/09 marketing year. The extraction rate for the 2010/11 marketing year appears to be as high as the previous two years. These compare with the average monthly flour extraction rate from 1990/91 to 2007/08 of 74.6 percent and the highest marketing-year extraction rate over 1990/91 to 2007/08 of 75.9 percent for 1996/97. The 1996/97 marketing year, like 2008/09 and 2009/10, was a year of high wheat prices.
Feed use varies.Feed use of wheat varies with price and crop quality. Feeding wheat to livestock increases when the price premium between wheat and corn is narrow, which typically occurs in the summer after winter wheat is harvested but before corn is harvested. Wheat feeding also increases when wheat quality is impaired. The resulting price discounts reduce its value relative to corn. For example, when there is excessive rainfall at harvest time, some wheat varieties are susceptible to preharvest sprouting. When sprouting occurs, biochemical changes in the wheat kernel diminish baking qualities for food products, making the wheat suitable only as livestock feed.
U.S. exports are up in 2010/11. Projected U.S. 2010/11 exports are up sharply from 2009/10 due to adverse weather conditions elsewhere in the world. Severe drought greatly reduced wheat production among the Black Sea exporters, primarily Russia. Excessive rainfall at harvest reduced the export availability of milling quality wheat in Australia, Canada, and parts of Europe.
World market evolves. Longer term, growing global demand for wheat imports is concentrated in those developing countries where robust income and population growth underpin increases in demand. Such markets include Sub-Saharan Africa, Egypt, Pakistan, Algeria, Indonesia, the Philippines, and Brazil.
Ukraine, Russia, and Kazakhstan have become significant wheat exporters in recent years, together surpassing U.S. exports in 2008/09. These countries were net importers as recently as 1995, a year with adverse weather conditions for the region. Low production costs and new investment in their agricultural sectors have enabled their world market share to climb despite the region's highly variable weather and production. During the mid- to late-1990s, their combined share of world exports was less than 5 percent, averaging less than one million metric tons (mmt). Toward the end of the 2000s, their share of world exports had risen to more than 25 percent and for 2008 and 2009 exports averaged 36 mmt. For comparison, the U.S. share of world exports fluctuated up and down between 20 percent and 30 percent.
In 2010/11, the situation was changed dramatically by a very serious drought that sharply reduced Russian production and exports. Russian exports for 2010/11 are expected to be only slightly above 20 percent of the average of the previous two marketing years. Their expected ending stocks are less than half the ending stocks of the previous two years. With the return to more normal weather, production will recover.
However, export growth is likely to be slower than previously expected because of recent policy changes aimed at reducing Russia’s dependence on imported pork and poultry meat. Russia’s wheat export growth is expected to be limited by increased pig and poultry feeding. Policy goals, which have resulted in larger livestock numbers, were a major factor driving Russia’s grain export ban in 2010/11 as drought reduced domestic grain crops. Although exports will recover with higher production, more wheat is expected to be used domestically to supply the expanded livestock sector over the coming years.
Projections for U.S. Wheat Supply
and Use
The long-term projections for U.S.
wheat for 2011-20 are heavily influenced by prospects for increased foreign competition in global markets and wheat's slow yield gains. Both factors contribute to lower relative profitability compared with other domestic crops, thereby leading to lower domestic wheat area.
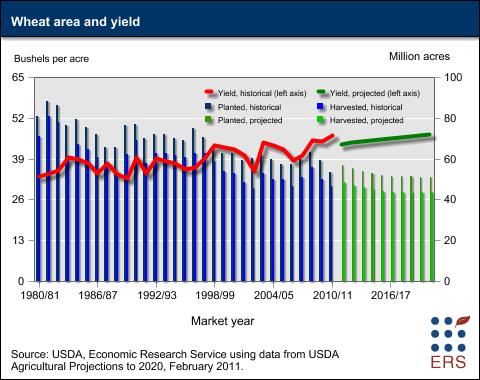
Wheat production is expected to decline until 2016 as declining acreage more than offsets gradually rising yields. Projected production falls from 2,125 million bushels to a low of 1,995 million bushels before slowly rising to 2,030 million bushels by the year 2020.
Wheat yields continue slowly rising. Yields for 2012 and beyond are a composite of historical trends by class of wheat beginning in 1985. The assumed annual increase averages 0.33 bushels per acre over the projection period. For comparison, corn and soybean annual trend-yield gains are projected at 2 bushels per acre and 0.45 bushels per acre, respectively.
The yield projected for 2011 is 43.8 bushels per acre, which is below the national all-wheat trend yield. This yield was projected using trends by type of wheat, adjusted for specific 2011 information. The 2011 trend-yield estimates for durum and other spring wheat did not include 2009 and 2010 yields because the weather in those years on the Northern Plains was unusually favorable for wheat and resulted in markedly higher yields than trend. The trend-yield estimate for winter wheat includes 2009 and 2010, but was adjusted to account for the expected recovery from the prevented plantings in the soft red winter (SRW) areas from 2010. Excessive rainfall delayed the fall 2009 row crop harvest, especially in the SRW areas, therefore, preventing timely winter wheat seeding for the 2010 crop. The all-winter-wheat trend yield is adjusted upward to account for the higher expected SRW area. SRW yields are typically higher than the average for all-winter wheat because of more abundant moisture.
Wheat plantings are expected to fall
over the next decade.Following an increase in wheat plantings for 2011, mostly in response to high prices, wheat area is projected to decline through the rest of the decade, reaching a low of 51 million by 2020. With relatively weak overall wheat demand growth and continuing large stocks, producer net returns above variable costs drop off quickly from a peak of more than $150 per acre for the 2011/12 marketing year and level off near $100 per acre.
 d
d
Get this chart as a
JPG
or a
PNG.
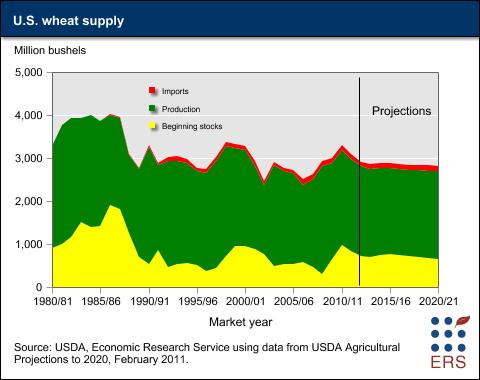
Projected supplies decline unevenly across the projection. Imports of wheat are expected to remain relatively small, but increase slowly, adding to U.S. supplies. However, beginning stocks are expected to fall from a high of 848 million bushels in 2011/12 to a low of 661 million bushels in 2020/21. Thus, total supplies are expected to fall from 3,083 million bushels to a low of 2,821 by the end of the projection period.
 d
d
Get this chart as a
JPG
or a
PNG.
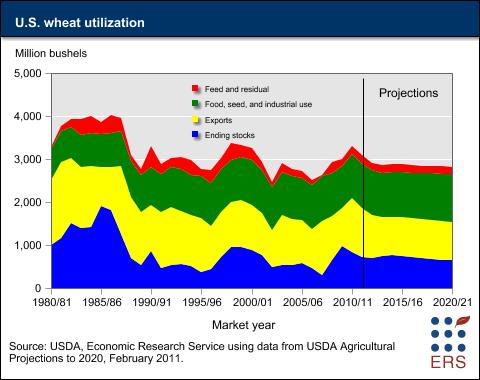
Total wheat use is projected to fall sharply in the near term with declining exports, then rise with slowly increasing food use. Total use of wheat is driven primarily by a sharp decline in exports in the first three years of projections. Exports in the first year are expected to decline from the high 2010/11 level. The severe 2010 drought in Russia triggered an export ban and reduced global exportable supplies. Unfavorable harvest weather reduced wheat quality in EU-27, Canada, and Australia, boosting 2010/11 demand for higher quality U.S. milling wheat. As Russian production recovers with more normal weather, the country will rebuild stocks and slowly increase its exports. While other countries also increase their exports, the recovery of Russian exports is the primary cause of the lower projected U.S. wheat exports in 2013/14 and beyond.
Russia’s exports expand over the projection from the low level in 2010/11, rising to account for 15 percent of global trade by then end of the decade. For the same time period, the U.S. market share of world trade declines from 27 percent to 16 percent.
As U.S. exports level off at 900 million bushels, growing domestic use slowly raises total wheat use. Domestic use rises due to increasing food use, while feed and residual use is unchanged for the rest of the period.
 d
d
Get this chart as a
JPG
or a
PNG.
Wheat food use increases slowly. Per capita food use of wheat in the United States has fallen sharply in recent years, but this decline is projected to end. Long-term annual growth in total food use reflects 1) slowing annual population gains from 0.91 percent to 0.85 percent, 2) stable per capita use, and 3) continuing high flour-extraction rate with high wheat prices.
Ending stocks remain high. Though stocks are lower at the end of the projection, they are still significantly larger than 600 million bushels. For comparison, in 2007/08, the year of the worldwide wheat shortage, U.S. ending stocks were only 306 million bushels, the lowest since the mid-1940s.
Wheat prices remain historically high. Wheat prices are projected to increase in 2011/12 largely due to high export demand. Expected prices then drop with lower exports, but remain high, supported, in part, by high corn and soybean prices. Prices drop from $6.50 per bushel for 2011/12 to a low of $5.45 mid-period before slowly rising to $5.60 as carryout stocks fall with rising food use.
Projections for World Wheat
Trade
The USDA baseline also provides projections for global
trends in wheat trade. The following discussion on wheat
trade is from the Global
Agricultural Trade chapter of the Agricultural
Baseline Projections briefing room.
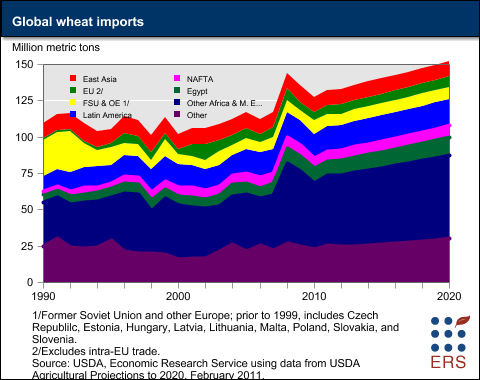
World wheat imports to expand. World wheat imports (including flour) expand by 20 million tons (15 percent) between 2011 and 2020 to nearly 152 million tons. Growth in wheat imports is concentrated in those developing countries where income and population gains drive increases in demand. The largest growth markets include Sub-Saharan Africa, Egypt, Indonesia, Algeria, Saudi Arabia, and other countries in the Africa and Middle East region.
- In many developing countries, almost no change in per capita wheat consumption is expected, but imports are projected to expand modestly because of population growth and limited potential to expand production. Rising per capita consumption of wheat in Indonesia, Vietnam, and some other Asian countries, reflects a dietary shift from rice as incomes rise. Nonetheless, overall global per capita wheat consumption is projected to decline slightly during the coming decade.
- Egypt maintains its position as the world’s largest wheat importing country, as its imports climb to more than 12 million tons. Imports by the EU, Algeria, Brazil, and Indonesia are each projected to exceed 6 million tons by 2020.
- Imports by countries in Africa and the Middle East rise 11.6 million tons and account for nearly 60 percent of the total increase in world wheat trade. Saudi Arabia has adopted a policy to phase out wheat production by 2016 because of water scarcity concerns, and imports are projected to rise to more than 3 million tons by 2020.
- China’s imports remain small as per capita consumption of wheat is expected to continue to decline.
- EU wheat used to produce ethanol is projected to continue rising rapidly during the first half of the projection period, especially in the United Kingdom.
- Abundant quantities of feed-quality wheat in a number of countries enable wheat to compete effectively with corn for feed use in the early years of the projection period. Europe is expected to continue to account for nearly half of global wheat feeding.
 d
d
Get this chart as a JPG or a PNG
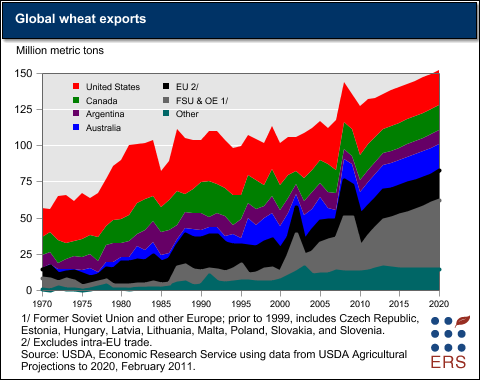
World wheat exporter competition to increase.The traditional five largest wheat exporters (the United States, Australia, the EU, Argentina, and Canada) are projected to account for almost 60 percent of world trade in 2020, compared with 70 percent during the last decade. This decrease in share is mostly due to increased exports from the Black Sea area. U.S. wheat exports are projected to account for less than 16 percent of global wheat trade at the end of the projection period, down from about 22 percent in the past 5 years. Although world wheat stocks are projected to continue increasing from their 2008 low during the next several years, prices are projected to remain above their pre-2006 average levels.
- Argentina is the only traditional exporter whose market share is not projected to decline. The shares of world wheat exports are projected to increase for Russia, Ukraine, Kazakhstan, and China, in addition to Argentina.
- Russia, Ukraine, and Kazakhstan have become significant wheat exporters in recent years. Low costs of production, new investments in agriculture production and marketing infrastructure, and generally favorable weather between 2001 and 2009 enabled their combined share of global wheat trade to rise to 36 percent in the 2 years before the 2010 drought caused exports to drop sharply. Exports from the former Soviet Union are expected to recover in the coming years and to account for about 30 percent of world exports by 2020. However, increasing wheat use for domestic feed is expected to restrain even more rapid export growth. Year-to-year volatility in production and trade, as occurred during the past year, can be expected because of the region’s highly variable weather and yields.
- EU wheat exports decline slowly over the next decade as more wheat is used for ethanol. EU exports drop to about 21 million tons in 2020, down about 18 percent from the 2008/09 peak.
- In Canada, increased global demand for vegetable oils (especially rapeseed oil) and for barley is expected to reduce wheat area and limit any growth in wheat exports.
- Wheat exports by by the smaller exporters change little during the projection period.
 d
d
Get this chart as a
JPG
or a
PNG.
Market Forces Constraints Future
Growth in U.S. Wheat Sector
The U.S. wheat sector is facing long-term challenges as productivity gains and returns for competing field crops outpace those for wheat. Over the next 10 years, U.S. wheat planted area is projected to fall sharply from the recent high in 2008/09. Wheat yield improvements are expected to continue lagging those for competing row crops, primarily corn and soybeans. U.S. exports are expected to stagnate with the increased global competition, particularly from Russia, Ukraine, and Kazakhstan. Furthermore, domestic food use, while growing, no longer provides the dynamic market growth experienced in the 1970s through the mid-1990s. Consequently, farmers will focus on other crops, such as corn and soybeans, because of low relative returns to wheat.


