USDA Wheat Baseline, 2010-19
Each year, USDA updates its 10-year projections of supply
and utilization for major field crops grown in the United
States, including wheat (see Overview
of the USDA Baseline Process for more information).
One key use of the projections is as a "baseline" from
which to analyze the impacts of potential policy changes
affecting U.S. agriculture.
This discussion summarizes analysis underlying the wheat
projections for 2010-19. Details about projections for
the U.S. macroeconomy, other U.S. crops, U.S. livestock,
farm income and food prices, and U.S. and global agricultural
trade, which are critical components of this analysis,
can be found in the Agricultural
Baseline Projections briefing room.
The U.S. wheat sector faces many long-term challenges.
- The long-term projections point to a smaller U.S.
wheat planted area compared to recent years, a continuation
of a long-term trend as profitability relative to other
crops, particularly corn and soybeans, has declined.
- The sharp decline in domestic food use of wheat since
2000—arising from changing consumer preferences—appears
to have ended with future growth likely to be limited
to population growth.
- Internationally, in addition to traditional global
competitors (Canada, Argentina, Australia, and the European
Union), Ukraine and Russia have emerged as new competitors
with the United States in foreign markets in years when
their production is high. The overall result in the
projections is a smaller U.S. share of an expanding
world wheat trade market.
The discussion is divided into five sections:
Supply Background
Several long-term factors play important roles in the
downward trend of the U.S. wheat crop during 2010-19.
Nonetheless, the United States remains a major wheat-producing
country, with output exceeded only by China, the European
Union (EU-27), and India. In the United States, wheat
ranks third among field crops in both planted acreage
and value of production, behind corn and soybeans.
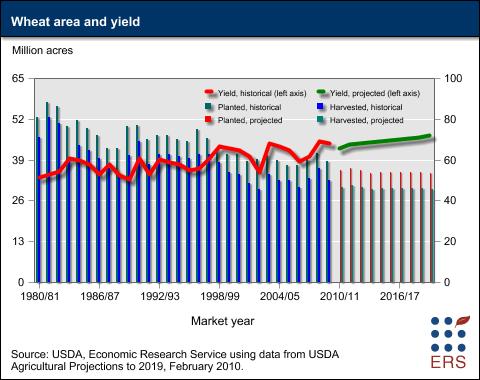
U.S. wheat planted area has trended down for many
years. U.S. wheat area has varied widely during the
past half-century, peaking in the early 1980s. Wheat area
dropped off sharply in the mid 1980s, primarily due to
relatively large Acreage
Reduction Program (ARP) levels implemented when Government-owned
stocks were very large. By 1987-88, nearly 30 percent
of the national wheat base acreage had been idled by farmers
participating in this voluntary program in order to be
eligible for commodity nonrecourse
loans and deficiency
payments. Wheat area recovered in the late 1980s through
mid-1990s as stocks declined and prices rose, thus lessening
the need for ARPs. ARPs were eliminated under 1996 Farm
Act, starting with the 1996 crop.
 d d
Get this chart as a JPG
or a PNG.
The introduction of full planting flexibility in the
1996 Farm
Act enabled farmers to switch to alternative crops or to idle
their land without affecting program benefits. Planting
flexibility increased competition for area among corn,
oilseeds, and wheat, which put downward pressure on U.S.
wheat acreage. Planted wheat area in the United States
is down by about 30 percent from an average of 85 million
acres in the early 1980s to an average of 59.6 million
acres over the past 5 years.
enabled farmers to switch to alternative crops or to idle
their land without affecting program benefits. Planting
flexibility increased competition for area among corn,
oilseeds, and wheat, which put downward pressure on U.S.
wheat acreage. Planted wheat area in the United States
is down by about 30 percent from an average of 85 million
acres in the early 1980s to an average of 59.6 million
acres over the past 5 years.
Wheat land switched to other uses. Wheat area
has dropped off in the United States as farmers have taken
their land out of production or switched to alternative
crops offering higher returns. Enrollment in the Conservation
Reserve Program (CRP) is concentrated in those regions
where wheat production predominates. About 60 percent
of the land enrolled in the CRP is located in the Plains
States, stretching from Texas to North Dakota and Montana.
USDA estimates that about 8 million acres of CRP land
had been planted to wheat or in a wheat-fallow rotation
prior to enrollment.
In the traditional wheat growing areas of the Plains
there is a longer-than-30-year trend to reduce area fallowed
by planting alternative crops and lengthening crop rotations.
One of the factors facilitating the planting of alternative
crops, corn and sorghum, for example, is the increased
use of reduced-till and no-till to increase water storage
in the soil allowing for improved yields of these crops.
For example, in western Kansas, the historical wheat/fallow
rotation has been most commonly replaced by a rotation
of wheat/grain sorghum/fallow in which wheat is planted
1 year out of 3 instead of 1 year out of 2. Though cropping
intensity increases, wheat is planted less frequently.
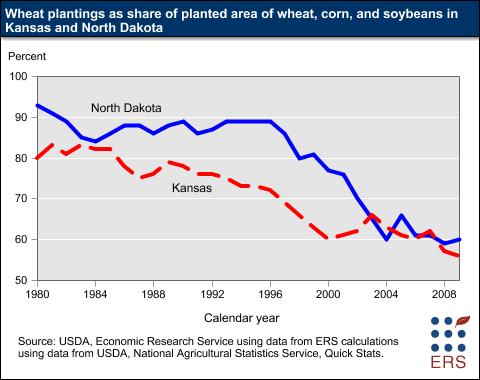
The trend of planting more corn and soybeans on acreage
traditionally planted to wheat can be illustrated by examining
data for Kansas and North Dakota, two of the country's
largest wheat-producing States. In the early 1980s, wheat
accounted for 80-90 percent of the total wheat, corn,
and soybeans planted in Kansas and North Dakota. In recent
years, wheat's share has dropped to 56-62 percent of the
total.
 d d
Get this chart as a JPG
or a PNG.
Genetic gains for competing crops on the Plains.
Loss of wheat acreage to row crops, such as corn and soybeans,
on the Plains reflects strong genetic improvements in
those alternative crops. New varieties of corn and soybeans
can be planted farther west and north in areas with drier
conditions or shorter growing seasons. Plus, weed control
is far easier with the development of herbicide-resistant
varieties (see the Agricultural
Biotechnology briefing room for more information).
The pace of genetic improvement has been slower for wheat
than for some other field crops, resulting in little growth
in wheat yields, which makes wheat a less attractive cropping
option for farmers. Genetic improvement for wheat has
been slower because of genetic complexity and because
of lower potential returns to commercial seed companies,
factors that discourage investment in research. For instance,
farmers have to buy seed corn each year because seed saved
from a hybrid cannot be used for a subsequent crop. This
creates a large annual market for seed companies and the
returns to investment needed to finance breeding programs
to develop improved varieties. In contrast, many wheat
farmers, particularly in the Plains States, use saved
seed from the previous year's crop instead of buying from
dealers every year because the wheat varieties grown in
the United States are not hybrids. This practice sharply
reduces the potential market for branded commercial seed
wheat and, thus, investment in seed development research.
 d d
Get this chart as a JPG
or a PNG.
Wheat disease also a factor. Concerns about wheat
disease problems in the Northern Plains, particularly
scab (head blight) in North Dakota and Minnesota, influenced
planting decisions starting in the 1990s and will do so
in the future. The increased incidence of this disease
may stem in part from larger corn plantings and reduced
tillage practices in traditional wheat areas in the Northern
Plains. Both activities provide hosts for disease organisms.
Ethanol expansion in the United States. A large
expansion in ethanol production has taken place in the
United States, which has affected virtually every aspect
of the field crops sector, ranging from domestic crop
utilization and exports to prices and the allocation of
acreage among crops. Cellulosic sources of feedstocks
for ethanol production hold some promise for the future,
but the primary feedstock in the United States is currently
corn. Market adjustments to this increased corn demand
extend well beyond the corn industry. In particular, this
has raised corn area and contributed to declines in wheat
area. Many aspects of the livestock sector are affected
too, including the substitution of ethanol byproduct feedstuffs
for corn and other feeds in rations.
Demand Background
Just as U.S. wheat production faces pressures from multiple
factors, several domestic and international market factors
underlie long-term developments for U.S. wheat demand
during 2010-19.
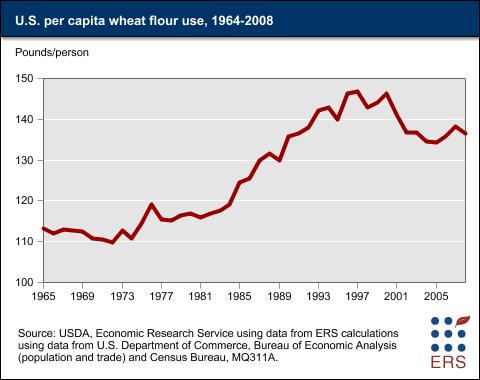
Decline in per capita flour use slows. Domestic
per capita wheat flour use for calendar year 2008 is estimated
at 136.6 pounds, 1.7 pounds below the 2007 estimate. Flour
use rose in 2006 and 2007 from the recent low of 134.4
pounds in 2005. This 2005 low was reached after the sharp
declines in per capita use from 146.3 pounds in 2000.
Until the late 1990s, U.S. wheat producers could count
on rising per capita food use of wheat to expand the domestic
market for their crop. The strength of this domestic market
developed out of the historic turnaround in U.S. per capita
wheat use that occurred in the early 1970s.
 d d
Get this chart as a JPG
or a PNG.
For nearly 100 years, per capita wheat use had declined
in the United States, as strenuous physical labor became
less common and diets became more diversified. Wheat use
dropped from over 225 pounds per person in 1879 to a low
of 110 pounds in 1972. By 1996, use had rebounded to 146.8
pounds per capita. The overall growth in per capita use
that occurred between 1973 and 1997 reflected changes
that included the boom in away-from-home eating, the desire
of consumers for greater variety and more convenience
in food products, promotion of wheat flour and pasta products
by industry organizations, and wider recognition of health
benefits stemming from eating high-fiber, grain-based
foods.
This growth ended in 1997 due to changing consumer preferences,
including more weight-conscious people following diets
with fewer carbohydrates. Consumer interest in these diets
spiked in 2000. The sharp drop in per capita flour use
that began in 2000 seems to have ended.
Feed use varies. Feed use of wheat varies with
price and crop quality. Feeding wheat to livestock increases
when the price premium between wheat and corn is narrow,
which typically occurs in the summer after winter wheat
is harvested, but before corn is harvested. Wheat feeding
also increases when wheat quality is impaired, reducing
its value relative to corn. For example, when there is
excessive rainfall at harvest time, some wheat varieties
are susceptible to preharvest sprouting. When sprouting
occurs, biochemical changes in the wheat kernel diminish
baking qualities for food products, making the wheat suitable
only as a low quality livestock feed.
U.S. exports down from recent peak. Projected
2009/10 exports, at 875 million bushels, are down 140
million bushels from 2008/09 and down 388 million bushels
from 2007/08. Exports in 2007/08 were at a 15-year high
as adverse weather around the world reduced global production
and increased the demand for U.S. wheat. Farmers in many
countries responded to the high prices that resulted from
the tightest global stocks-to-use situation in 30 years,
and the resulting additional supplies steadily reduced
the demand for relatively higher-priced U.S. wheat.
World market evolves. Longer term, growing global
demand for wheat imports is concentrated in those developing
countries where robust income and population growth underpin
increases in demand. Such markets include Sub-Saharan
Africa, Egypt, Pakistan, Algeria, Indonesia, the Philippines,
and Brazil.
Ukraine, Russia, and Kazakhstan have become significant
wheat exporters in recent years, together surpassing U.S.
exports in 2008/09. These countries were net importers
as recently as 1995. Low costs of production and new investment
in their agricultural sectors have enabled their world
market share to climb despite the region's highly variable
weather and production. During the mid- to late-1990s,
their combined share of world exports was less than 5
percent, averaging less than million metric tons (mmt).
Toward the end of the 2000s, their share of world exports
had risen to nearly 20 percent and for 2007 and 2008 exports
averaged nearly 22.5 mmt. For comparison, the U.S. share
of world exports fluctuated up and down between 20 percent
and 30 percent.
Projections for U.S. Wheat Supply
and Use
The long-term projections for U.S.
wheat for 2010-19 were heavily influenced by prospects for increased
foreign competition and wheat's slow yield gains as both
contribute to lower relative profitability compared with
other domestic crops and lower domestic wheat area.
for 2010-19 were heavily influenced by prospects for increased
foreign competition and wheat's slow yield gains as both
contribute to lower relative profitability compared with
other domestic crops and lower domestic wheat area.
Wheat yields continue slowly rising. Yields for
2011 and beyond are national all-wheat trend-yields using
1985-2009 data. The assumed annual increase averages 0.35
bushels per acre over the projection period. For comparison,
corn and soybean annual trend-yield gains are projected
at 2 bushels per acre and 0.4 bushels per acre, respectively.
The yield assumption for 2010 is 42.7 bushels per acre,
which is below the national all-wheat trend yield. This
yield was projected using trends by type of wheat, adjusted
for specific 2010 information. The 2010 trend-yield estimates
for durum and other spring wheat did not include 2009
because 2009 growing season weather in the Northern Plains
was unusually favorable for wheat and resulted in markedly
higher yields than trend. The trend-yield estimate for
winter wheat includes 2009, but was adjusted to account
for prevented plantings in the soft red winter (SRW) areas.
Excessive rainfall delayed the fall row crop harvest,
especially in the SRW areas, therefore, preventing timely
winter wheat seeding. The all-winter-wheat trend yield
is adjusted downward to account for the lower expected
SRW area. SRW yields are typically higher than the average
for all-winter wheat because of more abundant moisture.
Wheat plantings expected to be fall with weak demand
over the next decade. Wheat plantings are
projected down in 2010 with relatively low prices at planting
and expected prevented plantings. Area then rebounds in
2011, the second year of the projections, with a normal
fall planting season. Planted area is then expected to
fall to a low of 53.5 million acres in 2013. With relatively
weak overall demand growth and continuing large stocks,
producer returns remain lower than in recent years.
 d d
Get this chart as a JPG
or a PNG.
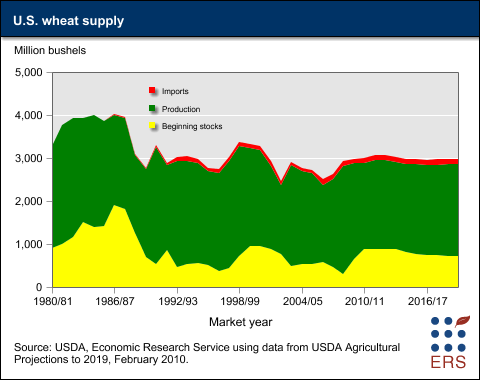
Wheat production is expected to expand slightly with
rising yields. Projected production rises in 2011
and then falls through 2013, when the planted area low
of 53.5 million occurs. Production then rises unevenly
with the increasing yields. Imports of wheat are expected
to remain relatively small, but increase slowly, adding
to U.S. supplies. However, beginning stocks are expected
to drift slowly down over the period. The result is that
U.S. wheat supplies are projected to fluctuate over the
10-year projections period with a slight downward trend.
 d d
Get this chart as a JPG
or a PNG.
Total use of wheat is projected to rise slowly.Total
use of U.S. wheat rises slowly over the next decade, mostly
due to gains in projected food use. Foreign demand for
U.S. wheat is expected to be limited to 900 million bushels
annually for most of the period. U.S. exports face increased
global competition, especially from the former Soviet
Union countries. Russia’s exports alone are projected
to surpass U.S. exports by 2016/17 and, by the end of
the 10-year period, are projected to exceed U.S. exports
by more than 150 million bushels. The U.S. share of world
wheat trade is projected to decline from 19.1 percent
to 16.4 percent over the
10-year period.
 d d
Get this chart as a JPG
or a PNG.
Wheat food use increases slowly. Per capita food
use of wheat in the United States has fallen sharply in
recent years, but this decline is projected to end in
the longer term. Total projected food use at the start
of the projection period is adjusted downward to reflect
a higher than average flour extraction rates for the 2009
crop. A high extraction rate means that fewer bushels
of wheat need to be milled to produce a given quantity
of flour. After some rebound due to an assumed return
to an average extraction rate, long-term annual growth
is 9 million bushels to the end of the projection period.
This growth in total food use reflects assumptions of
1) slowing annual population growth from 0.93 percent
to 0.86 percent, 2) constant per capita use, and 3) a
long-term average flour extraction rate.
Prices and stocks decline, but remain historically
high. Wheat prices are down from the recent spike
to the record $6.78 per bushel in 2008/09, but remain
historically high at $4.75 per bushel at the end of the
period. Stocks slowly decline from the current high levels,
but are still above 700 million bushels at the end of
the projections. For comparison, in 2007/08 the U.S. ending
stocks were only 306 million bushels, the lowest since
the mid-1940s.
Projections for World Wheat
Trade
The USDA baseline also provides projections for global
trends in wheat trade. The following discussion on wheat
trade is from the Global
Agricultural Trade chapter of the Agricultural
Baseline Projections briefing room.
World Wheat Imports. Growth in wheat
imports is concentrated in those developing countries
where income and population gains drive increases in demand.
The largest growth markets include Sub-Saharan Africa,
Egypt, Algeria, other countries in the Africa and Middle
East region, Pakistan, and Indonesia. World wheat trade
(including flour) expands by 25 million tons (20 percent)
between 2010 and 2019 to more than 149 million tons.
- Egypt maintains its position as the world's largest
wheat importing country, as its imports climb slowly
to more than 11 million tons. Imports by the EU,
Algeria, Brazil, and Indonesia are each projected to
exceed 6 million tons by 2019.
- Imports by developing countries in Africa and the
Middle East rise 13.2 million tons and account for more
than 50 percent of the total increase in world wheat
trade. Saudi Arabia has adopted a policy to phase out
wheat production by 2016 because of water scarcity concerns,
and imports are projected to rise to more than 3 million
tons by 2019. China’s per capita consumption of wheat
is expected to continue to decline.
- In most developing countries, almost no change in
per capita wheat consumption is expected, but imports
are projected to expand modestly because of population
growth and limited potential to expand production. Rising
per capita consumption of wheat in Indonesia, Vietnam,
and some other Asian countries, reflects a dietary shift
from rice as incomes rise. Nonetheless, overall global
per capita wheat consumption is projected to decline
slightly during the coming decade.
- Lower wheat-to-corn price ratios during most of the
projection period enable wheat to compete effectively
with corn for feed use in a number of countries. Europe
is expected to continue to account for about half of
global wheat feeding.
 d d
Get this chart as a JPG
or a
PNG
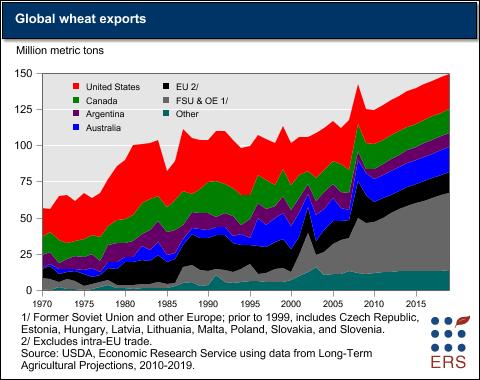
World wheat exports. The traditional
5 largest wheat-exporting nations (the United States,
Australia, the EU, Argentina, and Canada) are expected
to account for 55 percent of world trade in 2019, compared
with roughly 70 percent during the last 5 years. This
decrease in share is mostly due to increased exports from
the Black Sea area. U.S. wheat exports are projected to
account for less than 17 percent of global wheat trade
at the end of the projection period, down from about 25
percent in the past 5 years. Although world wheat stocks
are projected to continue increasing from their 2007 lows
during the next several years, prices are projected to
remain above their pre-2006 average levels.
- The shares of the world wheat market decline for Canada,
the United States, the EU, and Australia, while shares
increase for Russia, Ukraine, Kazakhstan, Argentina,
and China.
- Russia, Ukraine, and Kazakhstan have become significant
wheat exporters in recent years. Low costs of production,
new investments in agriculture, and generally favorable
weather since 2001 have enabled their combined share
of global wheat trade to climb to about 22 percent during
the last 3 years. Although Russia is expected to continue
increasing wheat production for domestic feed use, exports
from the FSU are projected to continue gaining market
share, and to account for about 35 percent of world
exports by 2019. However, because of the region’s highly
variable weather and yields, year-to-year volatility
in production and trade can be expected.
- EU wheat exports decline through 2012 as more wheat
is used for ethanol. EU exports then rise slowly during
the later years of the projection period, reaching 14
million
tons in 2019.
- In Canada, increased demand for vegetable oils (especially
rapeseed oil) and for barley is expected to reduce wheat
area and limit any growth in wheat exports.
- Wheat exports by Turkey and other smaller exporters
change little or trend slowly downward during the projection
period.
 d d
Get this chart as a JPG
or a PNG.
Market Forces Constraints Future
Growth in U.S. Wheat Sector
The U.S. wheat sector is facing long-term challenges
as productivity gains and returns for competing field
crops outpace those for wheat. Over the next 10 years,
U.S. wheat planted area is projected to fall sharply from
the recent high in 2008/09. Wheat yield improvements are
expected to continue lagging those for competing row crops,
primarily corn and soybeans. U.S. exports are expected
to stagnate with the increased global competition, particularly
from Russia, Ukraine, and Kazakhstan. Furthermore, domestic
food use, while growing, no longer provides the dynamic
market growth experienced in the 1970s through the mid-1990s.
Consequently, farmers will focus on other crops, such
as corn and soybeans, because of low relative returns
to wheat.
|


