American eating and drinking patterns
On an average day in 2007, Americans age 15 and older
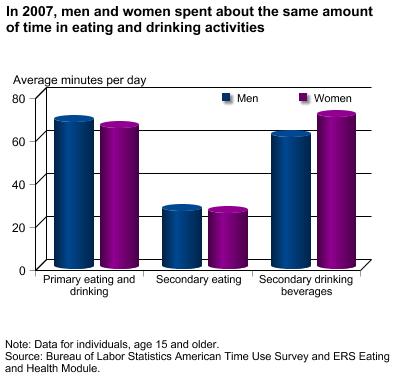
spent 67 minutes eating and drinking as a “primary,” or
main, activity, and 26 minutes eating and 66 minutes drinking
(except plain water) as a secondary activity—that
is, eating while engaged in another activity considered
primary by the individual. Eleven percent of the population
spent 4.5 hours or more a day on eating/drinking as either
a primary or secondary activity. About 12 percent of Americans’
secondary eating and drinking occurred while driving a
vehicle. Secondary eating or drinking was most frequently
accompanied by socializing, relaxing, and leisure, which
includes watching television.
Time spent eating and drinking
On an average day in 2007, the total time that Americans
spent on eating and drinking—both as primary and secondary
activities—and on activities related to eating and drinking
was about 157 minutes (2.6 hours), adjusting for overlap
of secondary eating and secondary drinking. Because secondary
eating and drinking activities may overlap, total
time estimates are less than the sum of estimates
for individual activities. All comparisons presented here
are statistically significant.
Men and women spent about the same amount of time on
primary and secondary eating/drinking. Four and one-half
percent of the American population did not engage in any
primary eating/drinking on an average day. However, this
group spent more time on secondary eating or drinking
than the total population—an average of 57 minutes
on secondary eating and 147 minutes (2.4 hours) on secondary
drinking.
A change to the survey instrument for the Eating and
Health Module resulted in increases in time spent in secondary
eating and secondary drinking between the 2006 and 2007
surveys. As of October 2006, respondents could report
“all day” for secondary eating or drinking,
excluding time spent in primary eating and sleeping. (See
User's Guide). Thus, increases in secondary eating
from 16 minutes in 2006 to 26 minutes in 2007 and in secondary
drinking from 42 minutes in 2006 to 66 minutes in 2007
result not from behavioral changes but from changes in
measurement. The percentage of people engaged in any secondary
eating or secondary drinking remained fairly constant
from 2006 to 2007.
In 2007, 2 percent of those who engaged in secondary
eating reported eating “all day”, whereas
in 2006, less than one percent reported “all day”
snacking, representing a small, but expected increase
with the survey change. However, 10 percent of those who
engaged in secondary drinking reported “all day”
beverages in 2007, a marked increase from about 1 percent
in 2006.
The median amount of time spent in secondary eating was
15 minutes in 2007, unchanged from 2006. For secondary
drinking, the median time spent was also 15 minutes, up
from the 2006 median of 10 minutes. The median is less
affected by a small number of high values in the population.
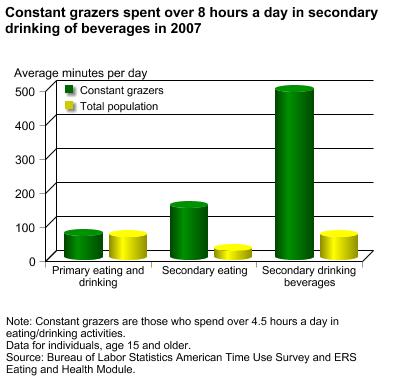
“Constant grazers” are defined here as those who spend
at least 4.5 hours a day (about twice the 2006 average
time) on primary or secondary eating or drinking activities.
This group makes up 11.1 percent of the population. Constant
grazers spent the majority of eating time on secondary
drinking—an average of 8.2 hours. About 10 percent of
constant grazers reported secondary eating “all
day” and 33 percent reported “all day”
drinking of beverages.
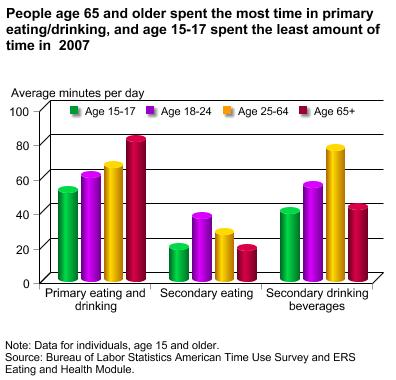
Individuals age 65 and older spent more time on primary
eating and drinking (an average of 81 minutes per day),
and less time on secondary eating and drinking than younger
age groups.
Over the course of a day, about 23 percent of the population
was engaged in some eating or drinking activity at some
time between 7 a.m. and 10 a.m. Between 12 p.m. (noon)
and 1 p.m., 43 percent of Americans were eating and/or
drinking. The share of Americans engaged in eating or
drinking activities during the evening peaked at 40 percent
between 6 p.m. and 7 p.m.
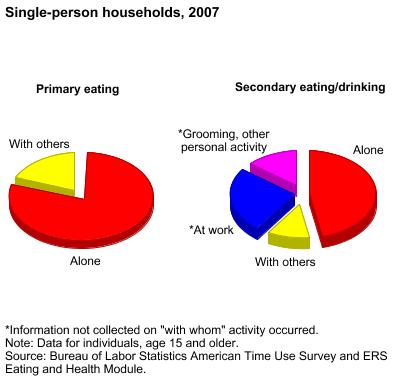
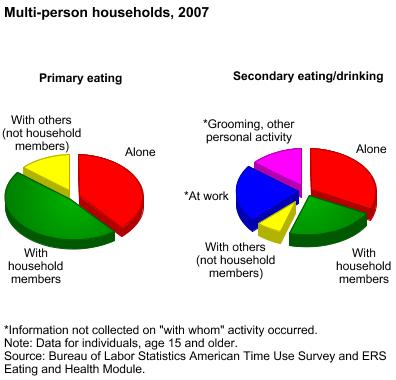
Not surprisingly, people who live alone were more likely
to eat alone. Individuals in single-person households
ate alone for primary eating/drinking 81 percent of the
time. For secondary eating/drinking, 47 percent ate or
drank alone, and an additional 41 percent ate or drank
at work or while grooming (or other personal activity).
No information was collected on whether the respondent
was alone or with someone for time spent at work or while
engaged in a personal activity.
People in multi-person households ate with household
members 47 percent of time for primary eating. However,
only 23 percent of secondary eating/drinking time was
with household members, and a total of 37 percent of the
time was at work or while engaged in personal activities,
about the same as for persons who live alone.
Estimating total time eating
and drinking
There are three major considerations in estimating the
total time spent on eating and drinking. First, as the
data are collected, if a respondent reports both secondary
eating and secondary drinking during a primary activity,
it is not known whether secondary eating and secondary
drinking occurs at the same time. ERS developed a method
of estimating total time spent on secondary eating and
drinking to account for this overlap. An alternative approach
is to use a range of total time. ERS also recommends analyzing
primary and secondary time use components separately.
Most secondary eating is done without secondary drinking
and vice versa; in only 36 percent of the cases were both
secondary eating and secondary drinking reported during
the same primary activity.
Second, when summing any primary activity and any secondary
activity, there is a concern that the intensity of the
activities may be different. Consequently, the sum may
overstate the total time spent on eating and drinking.
Third, due to the constraints of a 24-hour day, primary
and secondary activities should not be summed since this
would result in a day longer than 24 hours. See
Documentation and Methodology.
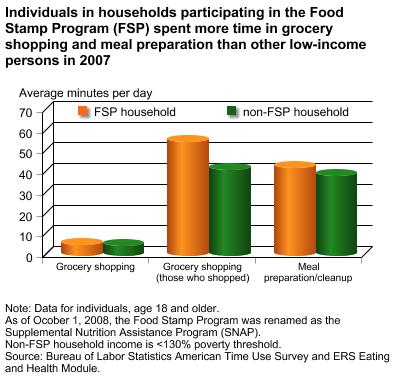
Food Stamp Program participants
Among low-income households, individuals in households
participating in the Food Stamp Program (FSP) spent more
time grocery shopping, preparing food, and caring for
children than individuals in low-income nonparticipating
households. The time engaged in housework was also about
the same for the two groups.
Respondents in FSP-participating households were less
likely to report excellent or very good general health,
and more likely to report good, fair, or poor health.
Indeed, 13 percent of individuals in FSP households reported
poor general health, whereas only 3 percent of the total
population considered their general health status as poor.
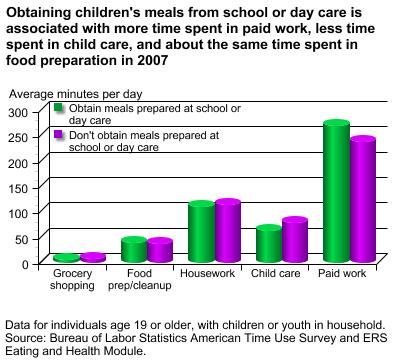
Meals obtained at school or day care
Respondents from households with children 18 years of
age or younger were asked if children in the household
obtained meals prepared at school, day care, or a summer
program. In 2007, 60 percent of households with children
reported that at least one child obtained either breakfast,
lunch or both meals from school, day care or a summer
program. In such households, adult respondents spent more
time in paid work, and less time in child care, housework,
and grocery shopping than did respondents from other households
with children. Interestingly, they did not spend less
time in food preparation and cleanup.
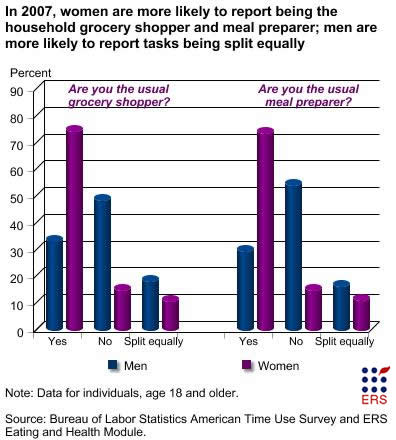
Grocery shopping and meal preparation
Based on self-reports, 48 percent of men were not the
usual person responsible for grocery shopping in the household
and 54 percent said they were not usual person responsible
for meal preparation; nearly three-quarters of women said
they were the usual person responsible for both tasks.
In addition, men were more likely than women to respond
that these tasks were split equally.
Among the usual grocery shoppers in the household for
all persons age 18 and older, men spent an average of
6 minutes a day grocery shopping, compared with 8 minutes
for women. Looking only at men who actually grocery shopped,
the average time was 40 minutes (noting that grocery shopping
is not a daily activity). All women averaged 9 minutes
a day grocery shopping, and among only those women who
actually shopped, they spent an average of 45 minutes.
Of those who split grocery shopping equally with other
household members, men still averaged 8 minutes a day
on the task, and women, 9 minutes. Among only those who
grocery shopped, men spent 40 minutes and women 50 minutes.
Among the usual meal preparers, men spent an average
of 27 minutes a day preparing meals, and women, 54 minutes.
Of those who split meal preparation equally with other
household members, men spent an average of 25 minutes
a day, and women, 37 minutes.
Body Mass Index
In 2007, time spent by Americans age 20 and older on
eating and drinking did not vary by Body Mass Index (BMI)—underweight,
normal weight, overweight, and obese. However, the average
times spent by Americans working for pay, sleeping, watching
television, and participating in sports and exercise varied
considerably by BMI levels. Individuals who are overweight
or obese spent more time watching television and less
time participating in sports and exercise than did those
of normal weight. The overweight group spent the most
time engaged in paid work activities and had a low average
time spent sleeping. The underweight group spent a greater
amount of time sleeping than the other groups.
|


