Understanding Rural America
County Types
Services Counties
Growth in the services sector has been the dominant force in nonmetro (as
well as national) industrial trends over the past two decades, giving rise to
the popular term "service economy." The services sector includes
transportation and public utilities, wholesale and retail trade, finance,
insurance, real estate, agricultural services, and other services. From 1979 to
1989, over 3 million nonmetro services jobs were created, accounting for 83
percent of new nonmetro jobs.
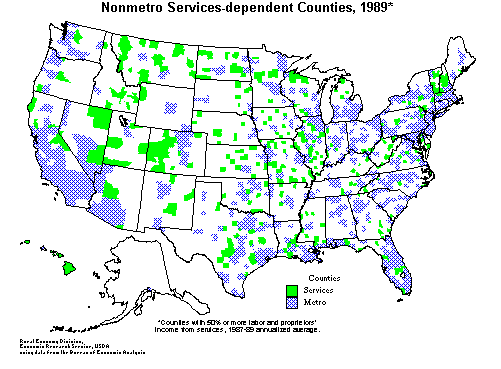
The 323 services-dependent counties, as defined here, derived 50 percent or
more of their earned income from services jobs over the 3-year period 1987-89.
Unlike farming and manufacturing counties, there is no regional pattern to the
location of services counties. Rather, they are scattered across the Nation
fairly evenly.
Map: Services counties did well and grew rapidly
during the 1980s.
Depending on their location, degree of urbanization, and access to a metro
area, services counties are likely to play different roles in an area's economy.
Services counties in the Great Plains are more likely to act as regional trade
centers to surrounding rural areas that lack large urban centers. Services
counties near natural amenities are more likely to act as providers of services
geared toward the needs of recreation, tourism, and retirement.
Seventy services counties (22 percent) were also retirement counties and 60
(19 percent) were also Federal lands counties. This is not surprising given the
dominant role that services play in the economies of those county types.
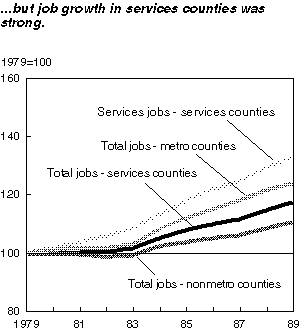
The economies of services counties did well during the 1980s. Total real
earnings grew by nearly 9 percent (more than twice the rate for nonmetro
counties as a whole), and earnings from services grew by 24 percent (nearly
twice as fast as the nonmetro average). The number of jobs in services counties
grew slightly faster (both in total jobs and services jobs) than in nonmetro
counties as a whole. Gains in two sectors--800,000 new services jobs and 76,000
new government jobs--dominated job growth in the services counties. However, the
economic performance of services counties presents something of a dilemma.
On one hand, services counties had, on average, lower unemployment, a
greater share of residents with high school educations, higher median family
income, higher per capita income, and higher per capita earnings than the
nonmetro average.
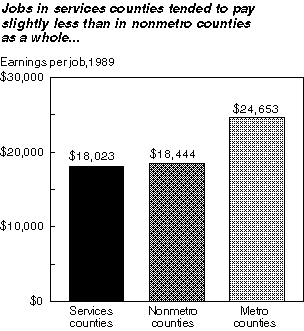
On the other hand, earnings per job were slightly lower and declined faster
than in nonmetro counties as a group (8 percent as compared with 6.5 percent)
during the 1980s. In fact, for nonmetro areas as a whole, earnings per job in
the services sector were the lowest of all industrial sectors examined. Services
jobs in services counties, however, tended to pay better than services jobs in
other counties. This may be partially explained by the role of services counties
as regional trade centers and support centers for recreation and retirement
areas and the higher paying services jobs--health care professionals, attorneys,
engineers, recreational outfitters, etc.--that accompany those roles.
Chart: Jobs in services counties tended to pay
slightly less than in nonmetro counties as a whole ...
Chart: ... but job growth in services counties
was strong.
The dilemma of high incomes and low earnings per job may be partly explained
by a higher than average ratio of "property income" (dividends,
interest, and rent) to earned income that raises income levels despite low
earnings per job. This explanation is consistent with the fact that 70 services
counties are also retirement-destination counties and retirees often have higher
levels of property income than younger people. Workers holding more than one
low-paying job may also be responsible. For example, a services worker might
hold one full-time and one part-time job, neither paying very high wages.
Finally, people with higher incomes may commute to higher
paying jobs in other possibly metro counties (note 3).
Population in services counties, on average, grew significantly (6.3 percent
versus 0.6 percent nonmetro average) during the 1980s. Part of that population
growth was due to inmigration, a rarity for rural counties. The growth in
population is not surprising given the good economic performance of these
counties, since the two usually go hand in hand.
Nationally and internationally, growth in the services industries will
likely continue in the future. The ability of rural areas to benefit from that
growth will depend on their individual situations. Rural areas near natural
amenities will probably see increasing demand for services associated with
recreational activities and retirement populations. Rural areas that act as
regional centers in sparsely populated parts of the country will depend on the
existence of a popu- lation base large enough to demand those services.
Therefore, these centers may be in trouble, if population loss trends in their
surrounding areas continue.
Go to:
Top of Page
Contact: webadmin@ers.usda.gov
Updated: March 4, 1997
|


