2009 Data Overview
U.S. agricultural exports generated employment, income, and purchasing power in both the farm and nonfarm sectors. ERS estimates that each dollar of U.S. agricultural exports stimulated another $1.31 in business activity in 2009. The $98.5 billion of agricultural exports in 2009 produced an additional $129.1 billion in economic activity for a total economic output of $227.6 billion. Every $1 billion of U.S. agricultural exports in 2009 required 8,400 American jobs throughout the economy. Calendar year 2009 agricultural exports required an estimated 828,000 full-time civilian jobs, which included 541,000 jobs in the nonfarm sector. The agricultural export surplus helped to offset some of the U.S. nonagricultural trade deficit.
Introduction
As the world’s economies become more integrated, global trade and the links between countries grow ever deeper. Though U.S. agricultural exports reversed course in 2009 and declined for the first time since 2002, U.S. agricultural trade is still a significant contributor to the overall U.S. economy, with impacts felt in countries worldwide. The United States is a net exporter of agricultural products, with the surplus helping to offset some of the U.S. nonfarm trade deficit of almost $650 billion in 2009. Agriculture is one of only a few sectors in the U.S. economy to produce a trade surplus.
Trade has always been important to U.S. farm and rural economies. From early colonial days, when tobacco and cotton were the most important export commodities, to today’s shipments of grains, oilseeds, and processed foods, agricultural trade has contributed to U.S. economic growth. Trade agreements have expanded agricultural trade with developed and developing countries and, in turn, have created growth opportunities for U.S. agriculture. Free trade agreements, such as the North America Free Trade Agreement, have lowered trade barriers and created additional consumer demand in foreign nations for U.S. agricultural commodities. That demand is then satisfied with purchasing power in foreign nations acquired, in part, when their products are sold in the United States and elsewhere.
While domestic harvests remained at about the same level in 2009 as in 2008, there were dips in both quantity and value of the U.S. agricultural exports that generate farm and economy-wide income. Foreign demand for these exports was spurred by continued economic growth in countries whose recessions were not as severe as that in the United States and by a still relatively soft U.S. dollar. The nominal exchange rates of the U.S. dollar were mixed in 2009: it remained at 2008 levels against the currencies of Japan and China but declined slightly against the euro, pound, Canadian dollar, and Mexican peso, making the price of U.S. goods more competitive in those countries.
Canada and China were the leading U.S. trading partners in 2009, followed by Mexico and Japan. Together, these nations accounted for over 50 percent of U.S. exports. Despite the weak buying power of the U.S. dollar, U.S. imports of agricultural goods in 2009 were 89 percent of the value of those in 2008 (versus 85 percent for exports). U.S. imports from Canada were worth $14.7 billion in 2009, down from $18.0 billion in 2008 but still 21 percent of all U.S. agricultural imports. Together, Canada, Mexico, and the European Union (EU) supplied 55 percent of all U.S. agricultural imports in 2009. Since 2005, the EU has been either the first- or the second-largest supplier of U.S. agricultural imports. If the EU, now comprising 27 member countries, were not considered a single entity, China would qualify as the third-largest supplier. U.S. agricultural imports from China totaled $2.9 billion in 2009, down from $3.5 billion in 2008. U.S. consumers continued to demand a large variety of imported goods in 2009 and were willing to pay a premium for them.
Agricultural trade is most importantly a generator of output, employment, and income in the U.S. economy. For every dollar spent on U.S. exports in 2009, it is estimated that another $1.31 was created in the U.S. economy to support the exporting activity. ERS Estimates of Agricultural Trade Multipliers show that every $1 billion of U.S. agricultural exports in 2009 required 8,400 American workers engaged in both direct and indirect supporting activities.
Impacts of Agricultural Trade in 2009
The impacts of agricultural trade on the U.S. economy change from year to year. Just as the composition of the agricultural export “basket” changes yearly, so, too, do the direct and indirect impacts on the economy. The structure of the U.S. economy also changes over time, which influences the domestic impacts of agricultural exports. The domestic economy is now dominated by the service sector, and the high level of supporting activity in those industries reflects that structure.
In calendar year 2009, the $98.5 billion of U.S. agricultural
exports produced an additional $129.1 billion in economic
activity for a total of $227.6 billion of economic output
(see U.S. economic activity triggered by agricultural
trade, 2009 ). Supporting activity was still well above the $100 billion mark surpassed in 2005. Agricultural exports also generated 828,000 full-time civilian jobs, including 541,000 jobs in the nonfarm sector. Farmers’ purchases of fuel, fertilizer, and other inputs to produce commodities for export spurred economic activity in the manufacturing, trade, and transportation sectors. (For information on how the data are derived, see ERS Estimates.) ). Supporting activity was still well above the $100 billion mark surpassed in 2005. Agricultural exports also generated 828,000 full-time civilian jobs, including 541,000 jobs in the nonfarm sector. Farmers’ purchases of fuel, fertilizer, and other inputs to produce commodities for export spurred economic activity in the manufacturing, trade, and transportation sectors. (For information on how the data are derived, see ERS Estimates.)
The production equivalent of over one-fourth of U.S. cropland moved into export channels in 2009. Of raw crops, the United States exported 40 percent of food-grain production, 15 percent of feed grains, and more than 44 percent of oilseeds. Coarse grain exports as a percentage of production held steady in 2009 from 2008 levels. And, because the value of all U.S. agricultural exports exceeded that of all U.S. agricultural imports, net agricultural exports in 2009 contributed $27 billion to the overall U.S. economy, a decrease of only $8 billion from $35 billion in 2008. In contrast, the value of direct exports dropped $17 billion over the same period.
Exports Generated New Business, Added Jobs
Of the $98.5 billion in direct U.S. agricultural exports in 2009, exported raw products accounted for $36.0 billion, compared with $40.9 billion for processed commodities and $21.5 billion for transport and trade services. Over $129 billion of supporting or indirect activity was generated by U.S. agricultural exports in 2009, encompassing the value of activity required to facilitate the movement of exports to their final destination (e.g., computer and financial services, warehousing and distribution, packaging, and additional processing). The service sector generated $54.8 billion of the total. Nonfarm sectors of the economy received about 79 percent of this additional economic activity.
Employment required to produce, transport, and service
agricultural exports decreased to 828,000 in 2009 from
920,000 in 2008. Price changes, which affect the estimates
of workers per billion dollars of exports, as well as the
export commodity mix and the volume of goods exported,
accounted for the decrease. Of the 828,000 full-time civilian
jobs related to agricultural exports in 2009, more than
287,000 were U.S. farm workers. Based on a Bureau of Labor
Statistics estimate of 1,822,000 (Because BLS had not
yet made an estimate of 2009 farm jobs at the time of this
analysis, this figure is calculated by moving the 2008
farm employment figure by the ratio of BLS estimates of
all agricultural jobs from 2008 to 2009.) full-time-equivalent
agricultural workers, this implies that approximately 16
percent of the U.S. farm workforce is producing for export.
In 2009, 541,000 jobs in the nonfarm sector were involved
in assembling, processing, distributing, and servicing
agricultural products for export, a decrease of 67,000
from 2008. About 100,000 of those nonfarm jobs were in
food processing, 169,000 were in trade and transportation,
60,000 were in other manufacturing sectors, and 212,000
were in
other services.
 d d
PNG
| JPG
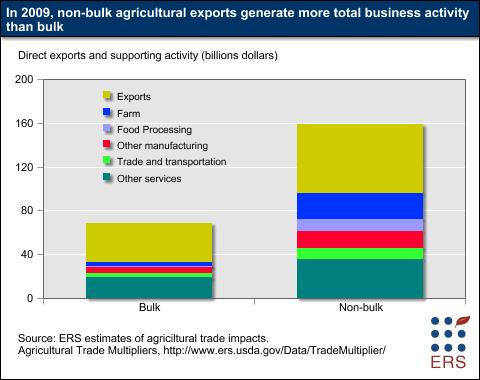
Bulk exports have a smaller proportional effect on the nonfarm economy than processed, or high-value, exports. Bulk exports of $36.0 billion in 2009 generated an additional $33.0 billion of business activity, while nonbulk exports of $62.5 billion generated $96.1 billion (i.e., $0.92 additional output per dollar for bulk exports, $1.54 for nonbulk exports, and $1.31 for all agricultural exports).
Over 58 percent of the additional business activity attributed to bulk exports took place in the service sector, and 0.3 percent was in food processing. In contrast, the shares of additional business activity attributed to nonbulk exports were 37 percent in services and 11 percent in food processing. Bulk exports supported 268,000 (32 percent) of the total jobs supported by exports; high-value product exports supported 560,000 (68 percent).
Impacts of Agricultural Imports on U.S. Output
It is not currently possible to measure the total economic activity associated with imports because there are no end-use data on imports available. When imports enter the United States, their value is recorded. After that, they are no longer tracked as imports but instead enter the general domestic economy to be used in the same fashion as domestically produced goods.
The end-use of a product is what determines its multiplier effects. Imports can be put into inventory (an almost negligible multiplier) or can be used in a highly processed product (a very large multiplier). Thus, without end-use data, the indirect or supporting impacts of actual agricultural imports cannot be measured in terms of output, employment, value-added, or as a multiplier. Only the value of imports as measured upon entry into the United States can be discerned (direct effects).
Imports can be assigned the generally held view of an economy-wide domestic business multiplier of between 2.00 and 2.50 because activities associated with “absorbed” imports are the same as those associated with any other domestic commodity. After adjusting for inflation from the benchmark year (2002) to 2009, the average output-weighted domestic business multiplier in 2009 for all U.S. business can be calculated as 2.24.
To illustrate the point, consider that almost all fish products are imported. If reliable statistics on consumption of fish were available, the supporting activity required to deliver imported fish could be measured. But this would be only part of the contribution of fish imports to the economy because fish is also turned into meal and feeds, processed products, pet foods, and other uses not related to direct human consumption. These uses become completely intertwined with domestic production. Finally, to fully measure all fish outputs, one would also have to separate the movement of imported fish products from the small but growing amount of products from domestic farm-raised fish.
Because of these data limitations, the economic impact of imports described here is the value of imported products as if they were produced in the United States and then assigned the value of that activity as a theoretical loss of economic activity to the United States. The only actual “loss” to the U.S. economy that can be measured is the actual value of agricultural imports.
The domestic output effect of the $71.7 billion of agricultural imports into the United States in 2009 was $169.1 billion. Just as with exports, moving imported products to consumers generates jobs in the data processing, financial, legal, management, administrative, marketing, and transportation sectors. Each dollar spent on agricultural imports in 2009 would have required another $1.36 in supporting goods and services if those imported items had been produced domestically, indicating an output multiplier of 2.36.
U.S. agricultural trade had a positive effect on all sectors of the economy in 2009. Even the food processing sector’s theoretical loss in trade in high-value processed products (-$6.5 billion) was offset by gains from trade in bulk products and the supporting activity associated with bulk and nonbulk trade. The farm sector’s $63.7 billion of output associated with agricultural exports more than offset the $33.3 billion of farm output implicitly lost because of agricultural imports. The nonfarm sectors, including food processing, gained $28.1 billion in total output via the agricultural trade balance, creating about 70,700 jobs and generating $12.9 billion in income. The U.S. economy gained a net $58.5 billion in output (after the theoretical loss to agricultural imports is considered).
Outside of farming and food processing, the United States gained a net $2.0 billion in 2009 from direct agricultural trade--that is, exports minus imports of agricultural goods that are neither farm nor processed goods (pharmaceuticals and adhesives, for example)--and $21.5 billion in total output because the direct plus indirect value of these exports was greater than that of the imports.
Total Jobs Required Per Billion Dollars of Agricultural Exports Rises in 2009
In 2008, 8,000 workers were required to deliver agricultural exports to their final consumer. In calendar year 2009, that number rose to 8,400 workers. The farm sector is the largest generator of jobs related to agricultural exports. Because farm price increases leveled off or retreated from the rise begun in 2007, particularly for the commodities that are included in bulk exports, the sector generated more employment per dollar of exports than other sectors.
When farm prices are low, customers buy large amounts of bulk grains and oilseeds. Jobs are created on the farm and in the supporting transportation and distribution industries, but job growth bypasses the processing and manufacturing sectors. In 2006, record-setting quantities of bulk commodities were exported, and because volume largely determines overall labor requirements, many farm and farm-related jobs were generated as a result.
In 2009, according to USDA’s National Agricultural Statistics Service, prices received by farmers for food grains, feed grains, and oilseeds decreased between 13 and 28 percent from 2008 prices. The total value of bulk exports decreased 26 percent, from $48.4 billion in 2008 to $36.0 billion in 2009.
Because some of the change in agricultural export value over 2008 was price driven, there was a modest upswing in actual jobs required per billion dollars of exports in 2009. Because most farm and closely related farm industry jobs are dependent on bulk exports, which saw the largest price decreases, farm jobs required per billion of agricultural exports increased in 2009. The dip in prices was not low enough, however, to overtake nonbulk exports in job creation as happened in 2006 because of high volume and low farm prices. In 2009, nonbulk exports generated 1,600 more jobs per billion dollars of exports than bulk.
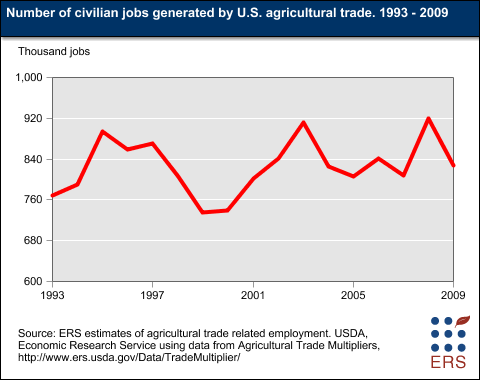
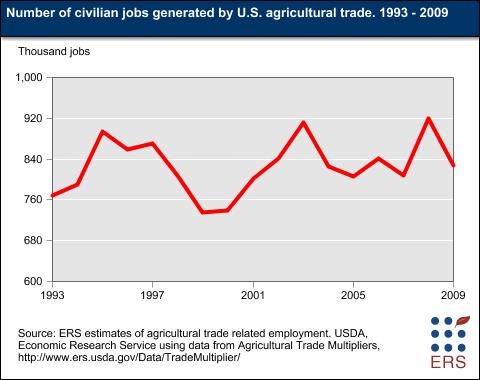
While the number of jobs per $1 billion of exports rose from 2008 to 2009, the total employment supporting U.S. agricultural exports decreased from 920,000 to 828,000 over the same period. In the early 1980s, $35 billion to $45 billion (in nominal dollars) of exports generated an estimated 1 million to 1.2 million jobs. In 2009, it took almost $100 billion of exports to create the 828,000 jobs. ERS estimates for 1983 indicate that $38 billion of agricultural exports created 1.1 million jobs that year, a multiplier of 29,000 jobs per billion dollars of exports (Foreign Agricultural Trade of the United States, 1984). Because of price changes, increased productivity, and structural/technological advances in the intervening years, the multiplier declined to 8,400 workers per billion dollars of exports in 2009.
 d d
PNG
| JPG
Historical Analysis
|


