USDA Rice Projections, 2008-17
With commodity prices high across the board, the competition among crops for acreage in the United States over the next decade will be keen, especially in regions like the Delta where multiple cropping options are available. For rice, despite rising prices and strong global demand, high production costs associated with U.S. rice farming will sharply limit area expansion. Although the domestic market continues to expand, the global rice market remains critical to the viability of the U.S. rice industry. Exports account for 45 percent or more of total use of U.S. rice each year, a much higher share than for most other major field crops.
Although the United States accounts for less than 2 percent of global production, it is currently the fourth-largest rice-exporting country. Stronger global demand and a tight supply situation in other major exporting countries will support rising U.S. exports over the next decade. While annual growth rates for domestic disappearance continue to expand, they have declined from levels achieved in the 1980s and 1990s.
Each year, USDA updates its 10-year projections of supply and utilization for major field crops grown in the United States and major producing countries and regions, including rice (see Overview of the USDA Baseline Process for more information). The commodity projections are used to forecast farm program costs and to prepare the President's budget. Another key use of the projections is as a reference from which to analyze policy changes affecting U.S. agriculture. This discussion summarizes the analysis underlying the rice projections for 2008/09-2017/18. Details about the projections for the U.S. macroeconomy, other U.S. crops, U.S. livestock, U.S. farm income, trade values, food prices, and global agricultural trade can be found in the Agricultural Baseline Projections briefing room.
The 2007/08 U.S. rice market has higher prices, stronger exports, and larger imports than a year earlier. U.S. rough-rice prices in 2007/08 are the highest since 1980/81, a result of very strong prices for other grains and oilseeds, higher global rice prices, and increased international demand for U.S. rice. In the global market, prices are being supported by record import demand, extremely high prices for other grains and oilseeds, and a tight exportable supply situation in much of Asia. As of mid-November 2007, quoted prices for Thailand's 100-percent grade B milled rice for export were up 15 percent from a year earlier. This is the sixth consecutive year of rising global rice prices. The 6-year global bull market for rice is largely due to declining global stocks, as consumption growth has out-paced production.
Projections for U.S. Rice Supply and Use
Highlighted below are the key assumptions regarding factors driving annual levels of production, trade, disappearance, and prices for rice in the United States for 2008/09-2017/18. Projection details can be obtained from U.S. rice supply and use table.
Supply
Several factors underlie the long-term trends in both plantings and yield growth that will determine the size of the U.S. rice crop during 2008/09-2017/18.
Expansion in rice plantings are sharply limited by high fuel and fertilizer prices and strong returns for alternative crops. Despite rising prices for U.S. rough rice over the next 10 years, rice plantings are projected to increase just 25,000 to 50,000 acres a year and to remain 200,000-400,000 acres below the 2005/06 level. The Delta is expected to account for nearly all of the modest expansion. Area expansion is strongest early in the period, but slows after 2013/14.

High prices for competing crops—primarily soybeans, feed grains, and wheat—plus high costs for fuel and fertilizer will keep several hundred thousand acres of former rice land out of rice production in the Delta. Little, if any, expansion is expected on the Gulf Coast, as this region has the highest per unit cost of production. California rice plantings are unlikely to vary much from current levels.
In past years, much higher rice yields boosted producer returns and typically offset the impacts of rising corn and soybean prices, limiting any contraction in rice acreage when corn and soybean prices rose. Soybeans are the primary rotation crop for rice producers in the Delta, the largest rice producing region in the United States. However, much higher fuel and fertilizer prices since 2005, and extremely high prices for competing crops since 2006/07, have made rice uncompetitive with soybeans, feed grains, and wheat in some areas of the Delta. In contrast to the Delta, there are few alternative planting options for rice growers in California or along much of the Gulf Coast.
Rice yields are projected to continue increasing. Average U.S. rice yields are projected to increase each year of the projection period after 2008, surpassing this year's record by 2009. Yields are projected to increase almost 1 percent per year from 2009 through 2011, as the South continues to adopt new, higher yielding long-grain varieties. U.S. yield growth is projected to slowly taper off after 2011, as adoption of the new varieties is nearly complete in the South. Yield growth in the latter part of the period is primarily due to continued improvements in management practices in all U.S. rice growing regions.
The 2007 average field yield was the highest on record, increasing 6 percent from a year earlier, with record yields achieved in every southern State except Texas. Weather was nearly ideal during most of the 2007 growing season in much of the South, a major factor in the extremely high yields.
U.S. rice farmers achieved record yields each year from 2000 to 2004, primarily due to the adoption of new, higher yielding long-grain varieties in the South. Weather problems in California and the South—including two severe Gulf Coast hurricanes—reduced yields in 2005. In 2006, yields recovered in the South, but a second, consecutive cold wet spring hindered California's yields. Over the past decade, yield growth has been slower in California than in the South, a result of several weather problems, a lack of new varieties, and environmental regulations—such as the phase-down of straw burning—which has made California rice fields more susceptible to disease.
Area expansion and rising yields are projected to boost annual U.S. production. U.S. rice production is projected to increase each year during the next decade, a result of both rising yields and a slight annual area expansion. By 2017, U.S. rice production is projected at 247.6 million hundredweight (cwt), 25 percent larger than the 2007/08 crop. By 2013, production will match the 2004 record of 232.4 million cwt.

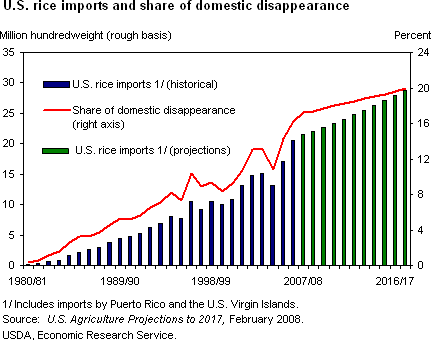
Imports are projected to account for a growing share of total supply. Since 1980/81, growing rice imports have accounted for a greater share of U.S. supplies. Currently, imports account for more than 8 percent of total supply. Imports are projected to increase 3 percent a year over the next decade. By 2017/18, imports are projected at a record 28.7 million cwt, accounting for 9-10 percent of total supply.
The bulk of U.S. rice imports are aromatic or fragrant rices—primarily jasmine from Thailand and smaller amounts of basmati rice from India and Pakistan. Classified as long-grains, these specific high-quality Asian aromatic varieties have not been successfully grown in the United States. While these varieties were once sold mostly in Asian neighborhoods and in major coastal cities, they are now available in most urban areas and in ethnic restaurants across the country. U.S. plant breeders are trying to develop U.S. varieties to compete with these high-quality aromatic imports. Aromatics account for nearly all of the projected increase in imports over the next decade.

In addition to the aromatic varieties, since 2001/02, the United States has imported significant quantities of medium- and short-grain rice. Puerto Rico—the largest U.S. territory—accounts for virtually all of these purchases. China, and to a lesser extent Egypt, have supplied nearly all of this rice since 2003/04. Both are expected to continue supplying this market. Australia had previously been a supplier, but prolonged drought took Australia out of this market. Prior to 2001/02, Puerto Rico was buying most of its rice from California. High prices for California rice and uncompetitive freight rates were the main factors behind the shift in source by Puerto Rico. The Jones Shipping Act requires all U.S. shipments from one U.S. port to another be on a U.S. flagged vessel. Freight rates on U.S. flagged vessels are much higher than global average freight rates. Imports of medium/short-grain rice are expected to remain at the 2007/08 record level, or increase slightly, over the projections.
Demand
Several factors will determine the long-term demand for U.S. rice in domestic and international markets, including U.S. population growth, the level of U.S. immigration, the ethnic makeup of the U.S. population, U.S. price competitiveness in global markets, and the size and composition of global rice trade.
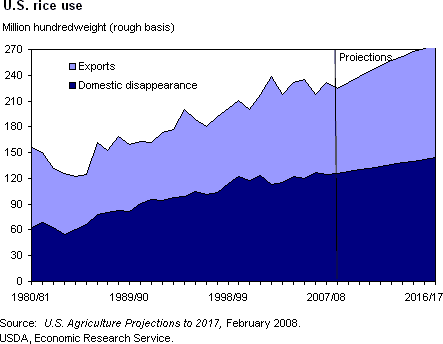
Domestic disappearance is expected to continue to increase. Total domestic and residual use (or domestic disappearance) is projected to climb each year of the period, reaching record levels after 2008/09. (The residual includes unreported losses in processing, marketing, and transportation, as well as any statistical errors in other components of the supply and use balance sheet.) Stronger domestic disappearance is primarily due to a rising U.S. population; increases in per capita disappearance are projected to be quite small. These projections assume domestic disappearance will expand about 1.5 percent annually, slightly ahead of population growth. This rate of expansion is well below the 5 percent achieved in the 1980s, and the 3-4 percent rates in the 1990s. The slowdown was likely due to a shift to Western diets away from rice-based diets by second- and third-generation Asian immigrants. A shift to protein diets from largely carbohydrate diets by many Americans early in the 21st Century contributed to slower expansion as well. This dietary shift has likely ended.

While the United States lost market share in the global rice market for nearly two decades, domestic disappearance has expanded virtually every year, outpacing population growth and leading to higher per capita disappearance. In 1980, domestic disappearance accounted for just 41 percent of total use. Exports accounted for the remainder. In 2007/08, domestic disappearance is projected to account for 54 percent of total use. A big increase in the Asian-American and Hispanic-American populations, introduction of new rice-based food products, and marketing efforts by the rice industry accounted for much of this long-term growth.

Imports are projected to account for a growing share of the domestic market. Since 1980/81, U.S. rice imports have accounted for an increasing share of domestic disappearance, currently accounting for more than 17 percent. Imports are projected to increase at nearly twice the annual rate of domestic disappearance. By 2017/18, imports of a record 28.7 million cwt will account for almost 20 percent of domestic disappearance.
U.S. exports are projected to show modest expansion. U.S. rice exports are projected to decline in 2008/09, a result of tight U.S. supplies. After 2008/09, U.S. exports expand each year of the projections, exceeding the 2002/03 record by 2015/16. By 2017/18, U.S. exports of 132 million cwt are projected 23 percent larger than in 2007/08. The U.S. export expansion is the result of expanding global trade, tight exportable supplies in Asia, increasing U.S. supplies, and a declining price difference with Asian competitors. In the United States, annual production growth is expected to exceed increases in domestic use, allowing exports to expand.
Beginning about 1980, the United States gradually lost market share in the global rice market for about two decades, primarily due to more competitive prices and improved quality from some Asian exporters. This was especially true in Middle Eastern and Sub-Saharan African markets, where Thailand and India gained market share. Milled rice accounted for all of the U.S. decline. By the early 21st Century, expanded sales of U.S. rough rice offset a continued decline in the U.S. share of the global milled market.
However, because of projected tight supplies in most Asian exporting countries, U.S. shipments of milled rice increase over the next decade, with the U.S. global market share stabilizing. The U.S. share of global rice trade—currently a little more than 11 percent—drops to about 10 percent in 2008/09 due to reduced U.S. exports. But with stronger exports of both milled and rough rice after 2008/09, the U.S. share slowly increases, before leveling off at 11.3 percent after 2013/14.
Rough rice exports are expected to increase and remain a major share of U.S. exports. While the United States lost substantial market share in the international market for milled rice—the bulk of global trade—it has tripled its rough exports since 1996/97. Rough rice exports accounted for 35 percent of U.S. rice exports in 2006/07, the highest share on record. The volume of U.S. rough rice exports reached a record 42.8 million cwt in 2002/03, with Brazil—a seasonal buyer—purchasing more than 7 million cwt. Rough exports are expected to continue expanding over the next 10 years and remain an important component of U.S. exports.
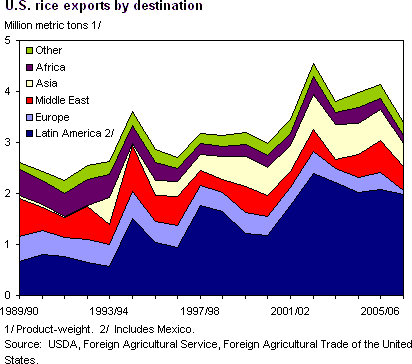
Mexico and Central America account for the bulk of U.S. rough rice exports, buying mostly southern long-grain. South America, primarily Brazil, sometimes imports substantial amounts of U.S. rough rice when regional supplies are inadequate. The United States accounts for nearly all the rice imported by Mexico and Central America and is the largest supplier of rice to Latin America from outside the region. Vietnam supplies the bulk of Cuba's rice. Thailand ships significant amounts of aromatic rice to both the United States and Canada. Besides these three markets, very little additional rice from Asia is sold in the Western Hemisphere.

Several factors account for the large U.S. market share in Latin America. First, the United States is the only major rice exporter that allows rough rice to be exported. The other top exporters—Thailand, Vietnam, India, Pakistan, and China—prohibit rough-rice exports, preferring to keep the value added from milling internally. Second, both Mexico and Central America prefer to import rough rice instead of milled rice. This allows their mills to operate at full capacity (achieving the lowest per unit production cost). Next, by importing rough rice from the United States and milling it domestically, Mexican and Central American millers do not face direct competition from Asian milled rice. More than 90 percent of the rice imported by Mexico and Central America is rough rice. Brazil prefers to purchase rough rice as well in years when the country purchases from non-South American sources.
Third, in addition to a locational advantage over Asian shippers, the United States has trade agreements—such as the North American Free Trade Agreement and the Dominican Republic-Central American Free Trade Agreement—that assist U.S. exporters in the region. The large share of U.S. rice exports that is shipped as rough rice to Mexico and Central America—a market where the United States faces little competition from Asian suppliers—has partially insulated U.S. exports from global price changes.
More than a decade ago, Turkey—a major medium- and short-grain market—began purchasing U.S. rough rice. However, from 2004/05-2006/07, import restrictions sharply reduced U.S. shipments to Turkey. The United States protested these import restrictions to the World Trade Organization, which issued a panel report in September 2007. Turkey resumed U.S. purchases of U.S. rice—both rough and milled—early in 2007/08. Until recently, the U.S. faced competition from Australia in the eastern Mediterranean medium-grain market. However, prolonged drought has sharply reduced Australia's rice exports—virtually all medium/short-grain. Egypt remains a major U.S. competitor in the eastern Mediterranean. However, a large domestic market and supply constraints will reduce Egypt's exports over the long term. Like Australia, Egypt produces and exports almost exclusively medium/short-grain rice.
U.S. milled rice exports are projected to increase over the next decade. The United States is expected to increase exports of milled rice over the projections period, a result of growing global demand and tight exportable supplies across most of Asia. The Middle East accounts for much of the growth in U.S. exports. Shipments to the Caribbean, Oceania, and European Union also increase.
For more than two decades, the United States lost substantial market share in the global market for milled rice. The re-emergence of Iraq in 2004/05 as a major buyer of U.S. long-grain milled rice halted the long-term decline in U.S. exports to the Middle East. Iraq is currently one of the largest buyers of U.S. rice. In 2007/08, U.S. sales to other Middle East markets expanded due to tight global supplies and recent export restrictions by India.
In 2006/07, the United States lost the bulk of its market in the European Union (EU)—a high-quality, long-grain market—due to costly testing requirements mandated by the EU, resulting from the discovery of trace amounts of genetically engineered (GE) rice in supplies of U.S. long-grain rice. The EU typically accounted for 10 percent of U.S. long-grain exports. The United States has regained a small amount of the EU market. In February 2008, the testing requirements were amended to allow point-of-origin testing. These projections assume some recovery of U.S. long-grain shipments to the EU.
Despite more competitive prices and stronger global trade, the United States remains uncompetitive among the huge Southeast Asian rice importers—primarily Indonesia, the Philippines, and Malaysia. Thailand and Vietnam supply the bulk of Southeast Asia's rice imports.
The United States is expected to maintain its market share in Northeast Asia—Japan, South Korea, and Taiwan. Northeast Asia imports almost exclusively medium/short-grain milled-rice, which accounts for 10-12 percent of global rice trade. Rice imports by these three Northeast Asian countries are the result of World Trade Organization (WTO) agreements. None of the three countries is projected to import beyond its WTO commitments. Milled and brown rice account for all of their imports. The United States supplies almost half of Japan's WTO rice imports and is a regular supplier to South Korea and Taiwan. South Korea, which agreed in 2005 to double its WTO imports by 2014, accounts for the only global growth in the Northeast Asian market. Japan and Taiwan's imports are assumed to remain at current levels over the next decade.
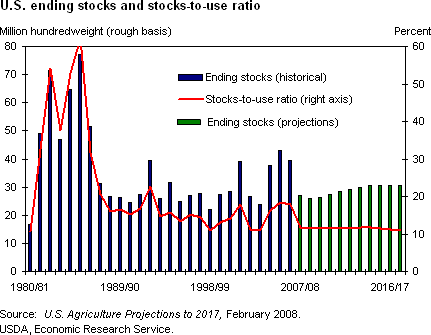
A small stocks build-up is projected over the decade. U.S. ending stocks are projected to decline in 2008/09, and then to slowly increase through 2014/15 before leveling off for the remainder of the projections. Despite the modest buildup, stocks are projected to remain well below the 2005/06 level of 43.0 million cwt. The stocks-to-use ratio declines to 11.5 percent in 2008/09, increases slightly through 2014/15, and then declines to 11.0 percent by the end of the period. These levels of stocks-to-use ratios will provide substantial price support throughout the period.

From 1997/98 to 2006/07, the stocks-to-use ratio averaged 14.5 percent. Strong global demand, continued growth in domestic use, and only a modest area expansion keep the stocks-to-use ratio well below the recent 10-year average.
Global prices are projected to increase. Global rice prices are projected to increase 2.5-3.0 percent a year, a result of increasing global rice trade and a tightening global stocks situation. Slow yield growth and little ability to expand area in most producing countries account for the tightening global stocks situation. This effect is partially offset by declining global per capita disappearance, largely due to dietary shifts away from traditional staple foods in Asia as incomes rise.
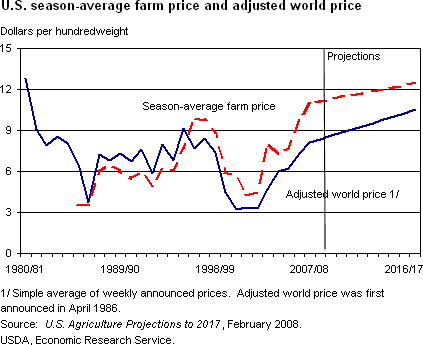
The adjusted world price, a weekly announced rough-rice price calculated by USDA that is used to determine marketing loan benefits, is projected to increase from $8.10 per cwt in 2007/08 to a record $10.53 by 2017/18. The adjusted world price is projected to remain well above the U.S. average rough-rice loan rate of $6.50 per cwt throughout the period. At these calculated price levels, no marketing loan payments for rice would be made to U.S. producers.
The U.S. season-average farm price increases each year. Strong prices for competing crops, rising global rice prices, and growing domestic demand are projected to push the U.S. season-average farm price higher each year. By 2017/18, the season-average price is projected to exceed $12.50 per cwt, the highest since 1980/81. Although net returns to U.S. rice production increase each year from 2009/10-2017/18, the area expansion is far too small to prevent prices from rising, primarily due to competition for land from other crops, especially corn and soybeans in the Delta.

U.S. prices are projected to increase at a slower pace than global prices each year, reducing the price difference over major Asian competitors. This difference decreases from $2.90 per cwt in 2007/08 to $2.00 by 2017/18, one of several factors supporting the expansion in U.S. exports over the next decade. The U.S. season-average farm price is projected to be high enough throughout the period to make producers ineligible for counter-cyclical payments.
Projections for World Rice Trade
International trade in rice is quite thin relative to total production. Only about 7 percent of global rice production is traded each year, well below the trade shares for other grains and oilseeds. Twenty years ago, the trade share for rice was barely 4 percent. Increased market access has accounted for much of the expansion. This has been especially true for much of Latin America, where countries began to open their markets to imports in the late 1980s. Despite greater market liberalization, many governments worldwide—especially in Northeast Asia—continue to severely limit rice imports and protect their producers. These policies limit the volume of world rice trade.
In addition to being a relatively thin market, the global rice market is heavily segmented, with little substitution among types and qualities by producers or consumers. Long grain typically accounts for more than 75 percent of global rice trade. Medium- and short-grain rice combined account for about 12 percent of global trade. Fragrant or aromatic rice accounts for about 12 percent. Specialty rices—primarily glutinous rice—account for most of the remainder. Rice can also be traded in various degrees of milling: fully milled (or polished) rice, brown rice (sometimes referred to as cargo rice), or rough (paddy) rice.
Fractional area expansion and slow yield growth limit increases in global production. Global rice production is projected to increase about 7 percent over the next decade, almost entirely due to rising yields. Average yields are projected to increase less than 1 percent a year—about the same average gain achieved during the previous 10 years, but well below growth achieved from the late 1960s through the 1980s, when modern high-yielding varieties were adopted in much of Asia and Latin America. Nearly all available land that can grow modern high-yielding varieties—primarily irrigated fields—has been switched to these varieties. High-yielding varieties for the less favorable ecosystems—dryland, flood-prone, and rainfed lowlands—have not been developed.
Global rice area is projected to remain nearly flat over the projections period, about 1 percent below the 1999/2000 record. Most Asian countries have little, if any, ability to expand rice area. Over the next decade, smaller plantings in China are projected to be nearly offset by expanded rice acreage in Sub-Saharan Africa and the Western Hemisphere. India, Sub-Saharan Africa, Bangladesh, the Philippines, Argentina, Brazil, other South American countries, Thailand, and the United States account for most of the expected increase in global rice production.
Global rice consumption is projected to increase almost 1 percent a year over the next decade, slightly outpacing production. Consumption growth is largely due to a rising population in Asia and a small increase in per capita rice disappearance in certain non-Asian rice-consuming countries, mostly in the Western Hemisphere and the Middle East. Many Asian countries—especially high- and medium-income countries—are experiencing declining per capita rice disappearance due to diet diversification resulting from higher incomes. Even in many low-income Asian countries, per capita rice disappearance is nearly stable.
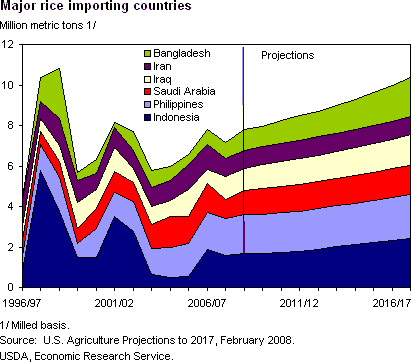
Total rice consumption in China—the world's largest rice-consuming country—is projected to remain flat over the decade, as the impact of population growth is offset by declining per capita rice consumption. In contrast, India, Indonesia, and Bangladesh—the largest rice-consuming countries after China—are expected to consume larger quantities of rice each year. These three Asian countries, plus Sub-Saharan Africa, the Philippines, and Iran, account for most of the expected increase in global rice consumption over the next 10 years.
On balance, consumption growth is projected to slightly outstrip production increases, pulling ending stocks down about 5 percent by 2017/18. The Philippines accounts for most of the decrease in global ending stocks over the next decade. In contrast, China is projected to boost stocks slightly after nearly a decade of decline. The global stocks-to-use ratio is expected to fall from 17.4 percent in 2007/08 to 15.5 percent in 2017/18, the smallest since 1977/78.
Global rice trade is expected to increase each year. Trade growth is projected to be slightly stronger in 2008/09 than in the rest of the projections. From 2009/10 until the end of the period, global rice trade is projected to increase 2.2-2.5 percent a year, reaching a record 37.4 million metric tons in 2017/18. Trade is expected to account for more than 8 percent of annual production by 2017/18, the highest share since before World War II. Increased global rice trade is primarily driven by rising import demand from Indonesia, the Philippines, Bangladesh, the Middle East, and Sub-Saharan Africa. Combined, these five markets account for about 70 percent of the increase in global rice imports over the projections period.

Rising imports by Indonesia and Bangladesh are driven by growing populations, little ability to expand rice area, and competition for arable land from substitute crops and nonagricultural uses. For Indonesia, land constraints and an already-high crop intensity—especially on the island of Java—indicate little opportunity to significantly expand production. Yields are projected to continue rising in Bangladesh, as its high-yielding boro crop continues to account for a larger share of total rice area. Even with expanded area and higher yields, production growth is not expected to keep pace with rising demand in the Philippines. Much of the recent increase in Philippine rice production has been due to the adoption of high-yielding hybrid varieties. In contrast to Indonesia, per capita disappearance is projected to continue rising in the Philippines and Bangladesh. Even with rising imports, domestic production is still expected to account for the bulk of the rice consumed in Indonesia, the Philippines, and Bangladesh.

Despite increasing production, Sub-Saharan Africa is expected to import larger quantities of rice each year to meet rising consumption, driven by a rapidly expanding population. No decline in per capita disappearance is expected for Sub-Saharan Africa; even with stronger economic growth, incomes remain too low for the majority of consumers to shift away from rice to higher valued foods. Imports account for slightly less than half of the rice consumed in the region.

Strong consumption growth is behind import expansion by the Middle East. Except for Iran and Turkey, the Middle East grows very little rice and imports account for almost two-thirds of its annual rice needs. Most of the Middle East is a high-quality import market.
Among smaller import markets, Central America, the Caribbean, Mexico, and the United States are all expected to increase rice imports during the projections. Production cannot keep pace with consumption growth in Central America, the Caribbean, and Mexico. Also, in these three markets, rising incomes typically boost per capita rice consumption. In Central America and the Caribbean, this is primarily due to the income level of most consumers. Mexico, which has a higher average income than Central America or the Caribbean, has one of the lowest per capita rice consumption levels in the Western Hemisphere, indicating substantial room for growth. Aromatic varieties account for nearly all expansion in U.S. imports.
In contrast to these expanding markets, imports are projected to decline over the decade for Brazil as per capita consumption declines—a result of rising incomes—and production increases. For many consumers in Brazil, income levels are high enough to slowly shift away from rice to higher valued foods. Iran's imports are projected flat over the next decade, as production growth offsets rising demand. Imports are projected to increase slightly for South Africa, a result of growth in consumption. South Africa does not produce rice.
Long-grain rice is expected to account for the bulk of the growth in global rice trade from 2008/09-2017/18. Long-grain rice is imported by a broad spectrum of countries in South and Southeast Asia, much of the Middle East, Sub-Saharan Africa, and Latin America. Medium/short-grain rice is primarily imported by Northeast Asia—Japan, South Korea, and Taiwan—and to a much lesser extent by several countries in the eastern Mediterranean, with Turkey the largest. Oceania imports smaller amounts of medium/short-grain rice. Expansion in the global medium/short-grain trade is projected to be much slower than for long grain.
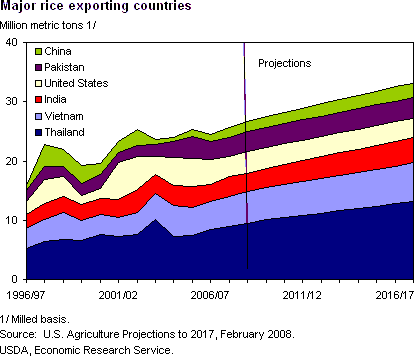
Asia and United States account for the bulk of rice exports. Asia is expected to continue to account for the bulk of rice exports over the projections period. Five countries—Thailand, Vietnam, India, Pakistan, and China—account for almost 75 percent of rice exports throughout the decade. The United States accounts for about 11 percent of global rice exports over the next decade.

Thailand and Vietnam, the world's largest rice-exporting countries, account for nearly half of all rice exports and nearly 75 percent of the projected increase. From 2007/08 to 2017/18, Thailand's exports increase 47 percent to more than 13.0 million metric tons. During the same time, Vietnam's exports increase 30 percent to 6.5 million metric tons. Rising production and declining per capita consumption account for the expansion in exports for both countries. Higher yields account for all of Vietnam's production expansion. Both area and yield increase over the next decade in Thailand. Their combined share of global rice trade increases from 48 to 53 percent over the next 10 years.
India's exports slowly decline over the next decade, as consumption growth outstrips production. India's exports decline from 3.6 million metric tons in 2008/09 to less than 3.3 million by 2017/18. India, currently the third largest exporter, drops to fourth in 2009/10. High internal price supports in the country continue to encourage large production and exportable supplies.
In contrast to India, the United States, Pakistan, and China are projected to increase exports over the next decade. The United States is projected to be the third-largest rice exporting country after 2008/09. U.S. exports increase each year after 2008/09, with the growth rate slowing after 2013/14. By 2017/18, U.S. exports of 3.75 million metric tons are 10 percent higher than in 2007/08. The U.S. share of global trade declines in 2008/09 to 10.2 percent and slowly increases to 11.3 percent by 2013/14, and remains unchanged the remainder of the projections period.
Pakistan—currently, the fifth-largest rice exporting country—has little ability to expand rice area. Producers are facing a growing water shortage, antiquated infrastructure, and agriculture-related environmental problems. Pakistan's exports are projected to increase just 100,000 metric tons over the decade, to 3.5 million metric tons by 2017/18, still below the 2005/06 record. Rice exports from China—currently, the world's sixth-largest exporter—increase from 1.7 million metric tons in 2008/09 to almost 2.5 million metric tons by 2017/18. Flat total consumption and a slight increase in production allow China to export a little more rice each year. Prior to 2003/04, China typically exported more than 2 million metric tons of rice a year. China reduced its exports in 2003/04 and 2004/05 due to tight supplies and high domestic prices.
Among the smaller exporting nations, Argentina is expected to increase exports over the projections period. Argentina's rice exports are projected to expand 5 percent a year during 2008/09-2017/18, as strong production growth more than offsets growth in domestic consumption. By 2017/18, Argentina exports 700,000 metric tons of rice, up more than 55 percent from 2007/08. Exports from other South American countries (Uruguay, Guyana, and Suriname) are projected to remain nearly flat over the next 10 years. Expanded shipments from Uruguay—the largest exporter in the region—will be partially offset by weaker shipments from Guyana and Suriname. Both Argentina and Uruguay produce rice mostly for export.
Only a slight recovery in exports is projected for Australia's rice industry. Several years of severe drought have reduced Australia to a very minor rice exporter. The country was once a major second-tier exporter. In the projections, rice area slowly increases over the next decade as reservoirs refill. Area reaches 50,000 hectares by 2015/16, well below the record 186,000 hectares harvested in 2000/01 and about even with the 2004/05 area.
Australia is projected to increase its rice exports each year over the next 10 years. However, by 2017/18, Australia's exports will still be less than 40,000 metric tons, well below the 200,000 exported in 2006/07 and just a small fraction of the more than 600,000 metric tons shipped in the late-1990s. Australia will be a net importer throughout the period, although imports decline after 2008/09 as production shows some recovery.
Egypt and the EU also export rice. Egypt's exports are projected to decline almost 30 percent over the next 10 years, as strong consumption growth outstrips a slight increase in production. Egypt's exports are currently at near-record levels. Little increase in area is projected, and Egypt's yields are already the highest in the world. Rice shipments from the EU are projected to increase slightly from 2008/09 to 2017/18. The EU is not price competitive in most global markets. Most EU rice exports are shipped to former colonies in Africa and the Middle East, as well as to countries in Central Asia and other parts of Europe. The EU ships a small amount of its high-quality Arborio rice, grown in Italy, to higher income countries.
|